Lakes of Barkly Tableland
Northern Territory | Central Australia
Dates of acquisition:
- January 10th, 2024 | 01:12:20 UTC
- December 31st, 2023 | 01:12:22 UTC
- September 27th, 2023 | 01:12:28 UTC
Sensor: Sentinel-2 L2A
Coordinates: ca. 18.8°S, 135.6°E
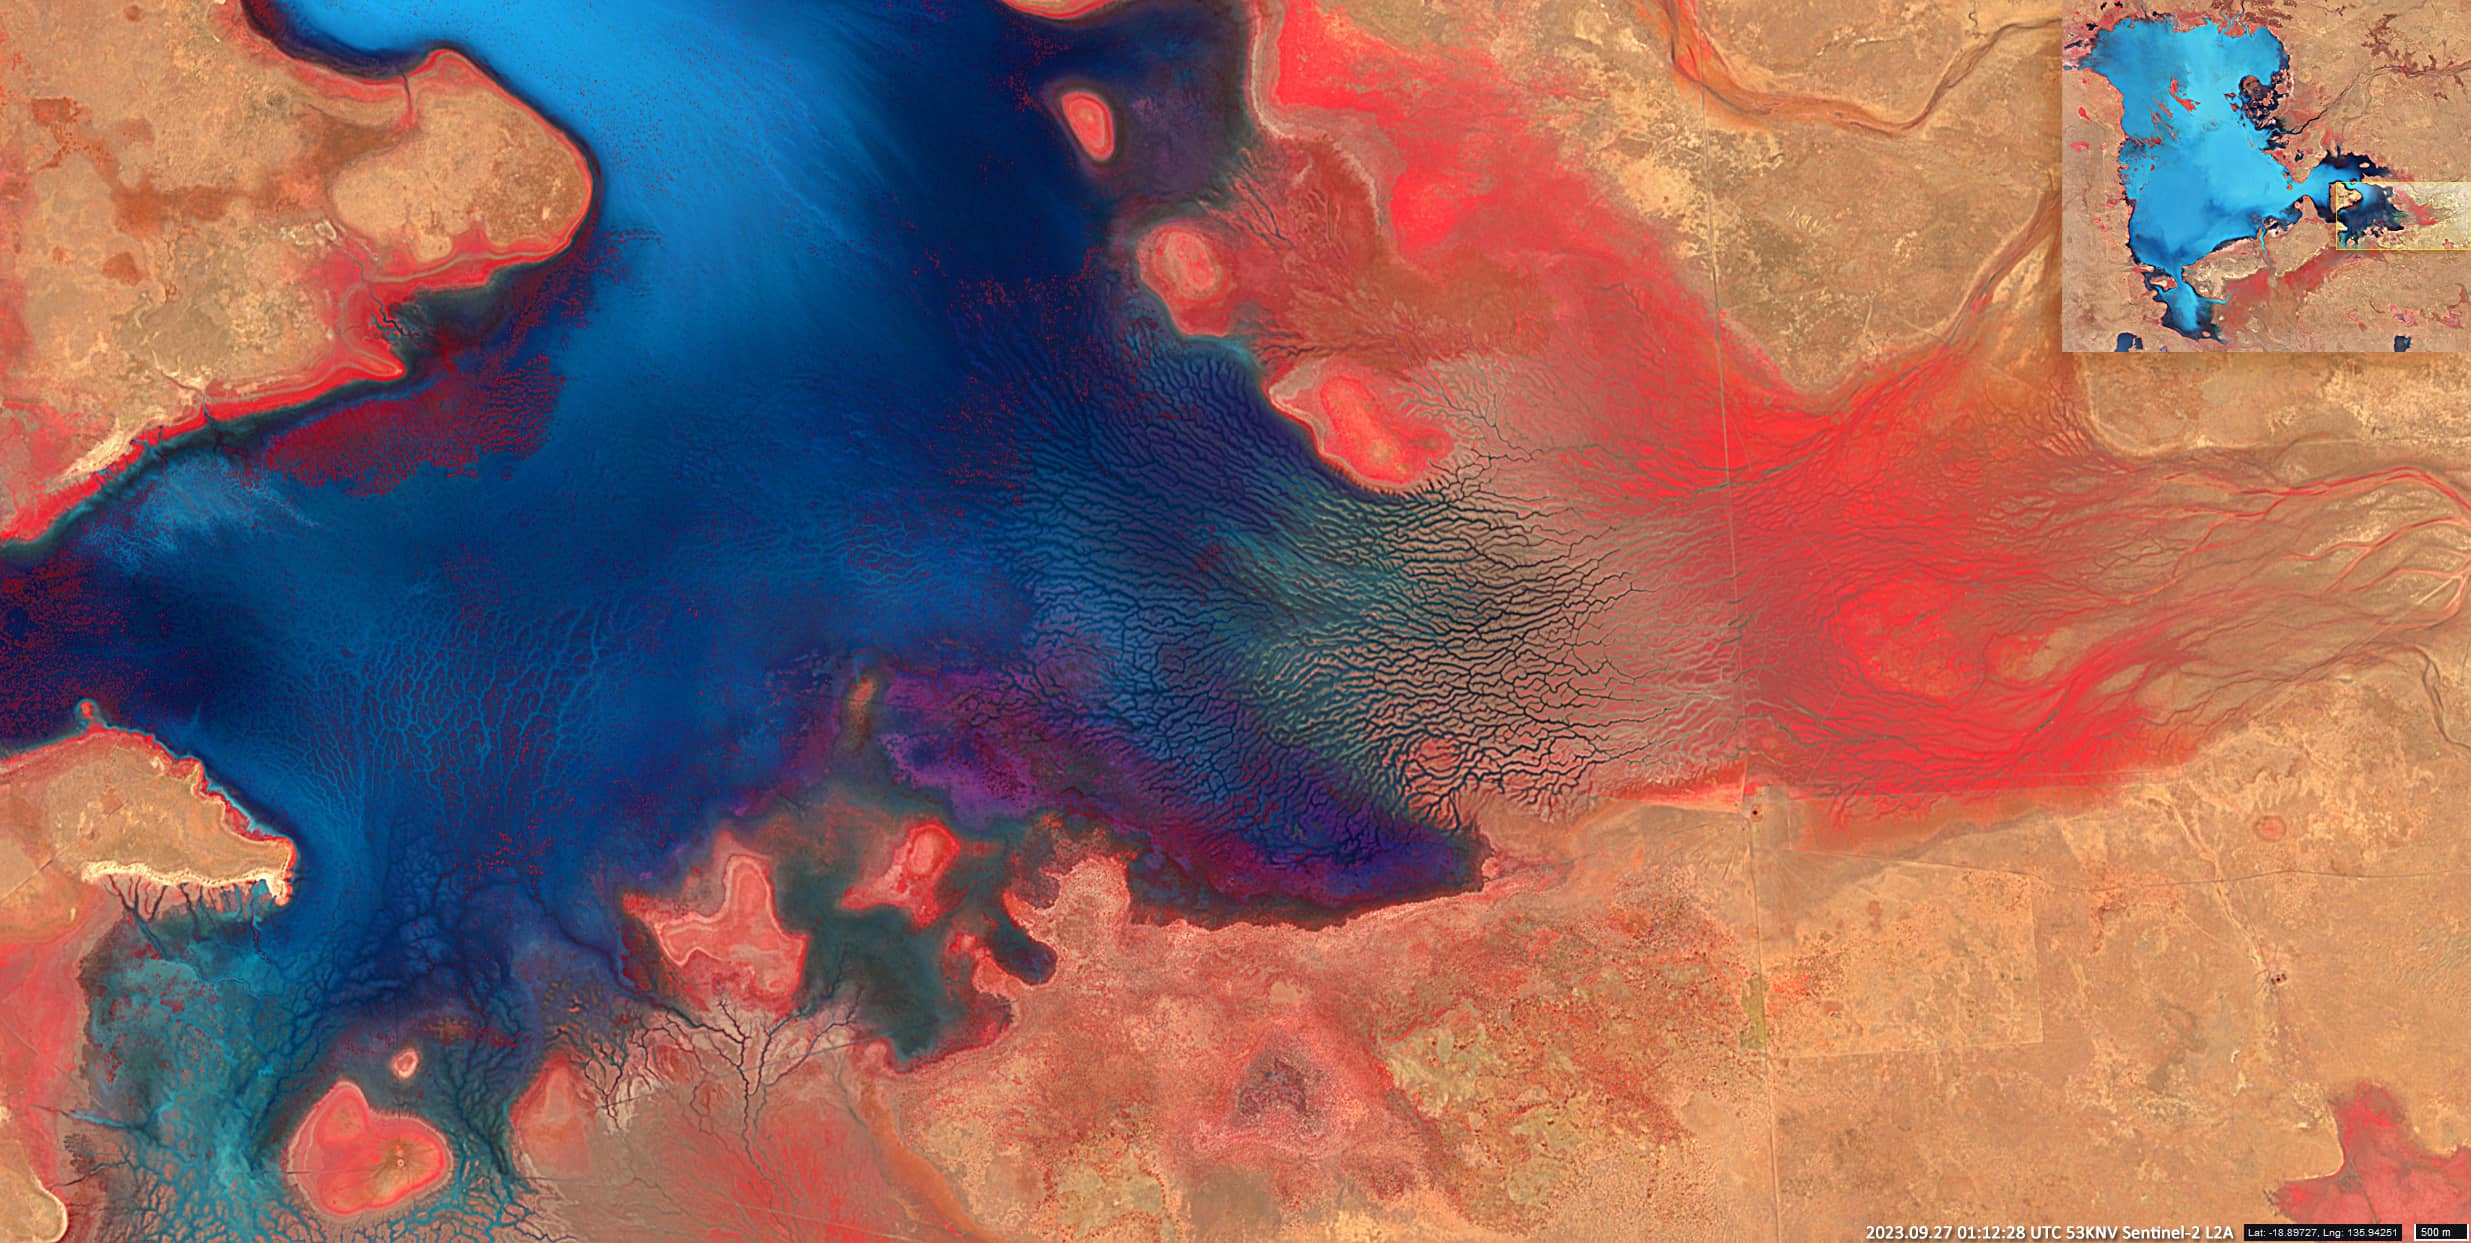
The delta of the Playford River, with its hundreds of branches flowing into Lake De Burgh, provides an aesthetic image. Noble purples, blues and whites combined with a “restless” sandy yellow with red touches; dynamically flowing fractal lines force the viewer to keep looking into the details again and again (Figure 1).
The image of the western Playford River Delta was acquired in the near-infrared by the Sentinel-2 satellite (false colour composite, based on bands 8, 4, 3 – RGB(8,4,3)).
Lake De Burgh, the southern part of the ephemeral freshwater Lake Sylvester System, is located on the Barkly Tableland in the Northern Territory state, in central Australia, 2200 km north-west of Canberra.
The Sylvester system also includes Sylvester Lake itself and Lake Corella to the north.
Lake Tarrabool, which is the largest swamp in tropical Australia when flooded, lies to the north-west of the Lake Sylvester System (Figure 4, RGB(4,3,2)).
The lakes are located in a flat area at an altitude of 205 to 210 meters. The area around the lakes is largely covered with swamps and meadows used for grazing. The population density is less than 2 people per square kilometer.
The climate is hot. The average annual rainfall is about 500 millimetres. The wettest month is February, with about 150 millimetres of rain, the driest month is June with 1 millimetre of rain.
Lake levels vary from year to year. The area of the Lake-System can be completely dry. Sometimes the Lake-System area consists of several separate, scattered bodies of water. In wet years they can merge. If all the reservoirs of the system merge into a single lake, its area can reach up to 2000 km². The flooded lakes can hold water for a long time.
Data from the Landsat 7 ETM+ (2005-2016) and Sentinel-2 (2017-2024) satellites can be used to track the water filling situation of the region in recent years. Figure 2 (RGB(8,4,3)) shows several examples of the state of the lakes, from completely dry (a) to several separate lakes (b, c, d) to completely full (e, f). The following table describes the state of the lake system in the months of January or February over the last 20 years (2005-2024). Yellow – the lake system is completely dry, green – there are several separate lakes, blue – the system is completely filled with water.

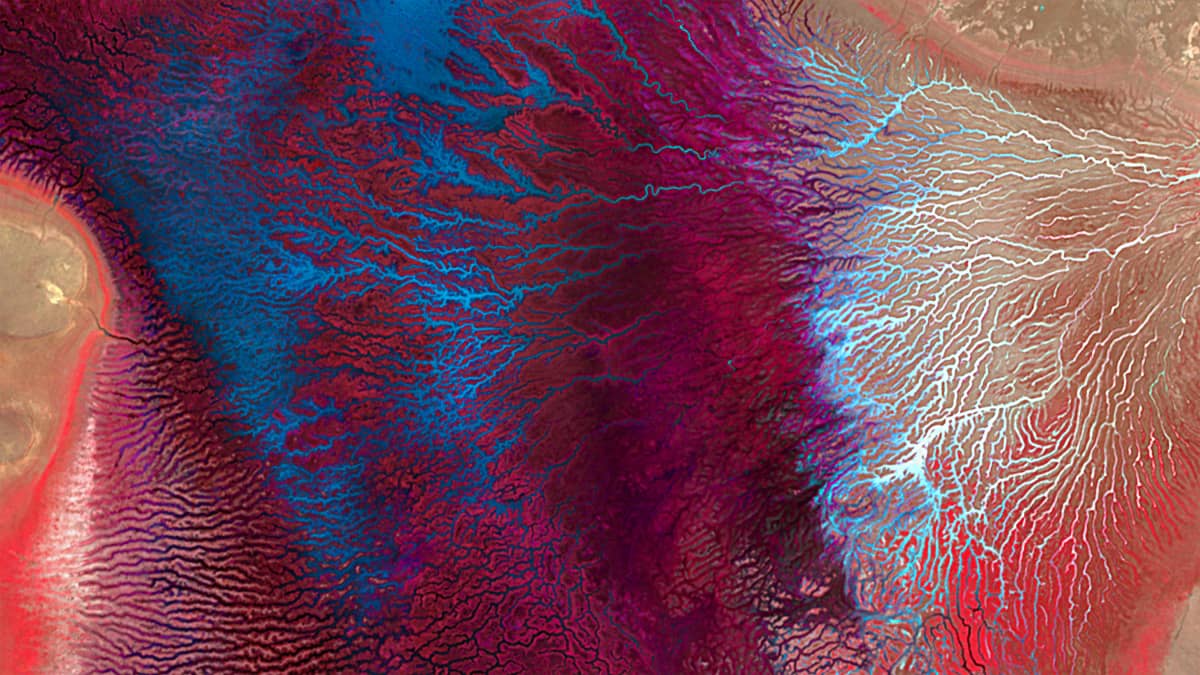
The animation “Figure 6” – (Sentinel-2, clear sky cases only, RGB(8,4,3)) shows the state of Lake De Burgh at key times in 2023. The animation “Figure 7” – (Sentinel-1, regardless of cloud cover) shows the state of the entire Lake Sylvester system in the last two years: 2022-2023. Finally, a visible (true colour composite, based on bands 4, 3, 2 – RGB(4,3,2)) and a near-infrared image (RGB(8,4,3)) of the eastern Playford River delta (Figure 3) as well as a rainbow-coloured image (RGB(8,4,3)) of the dry delta of an unnamed creek flowing into Lake Sylvester from the east (Figure 5) are presented.
Fig. 1
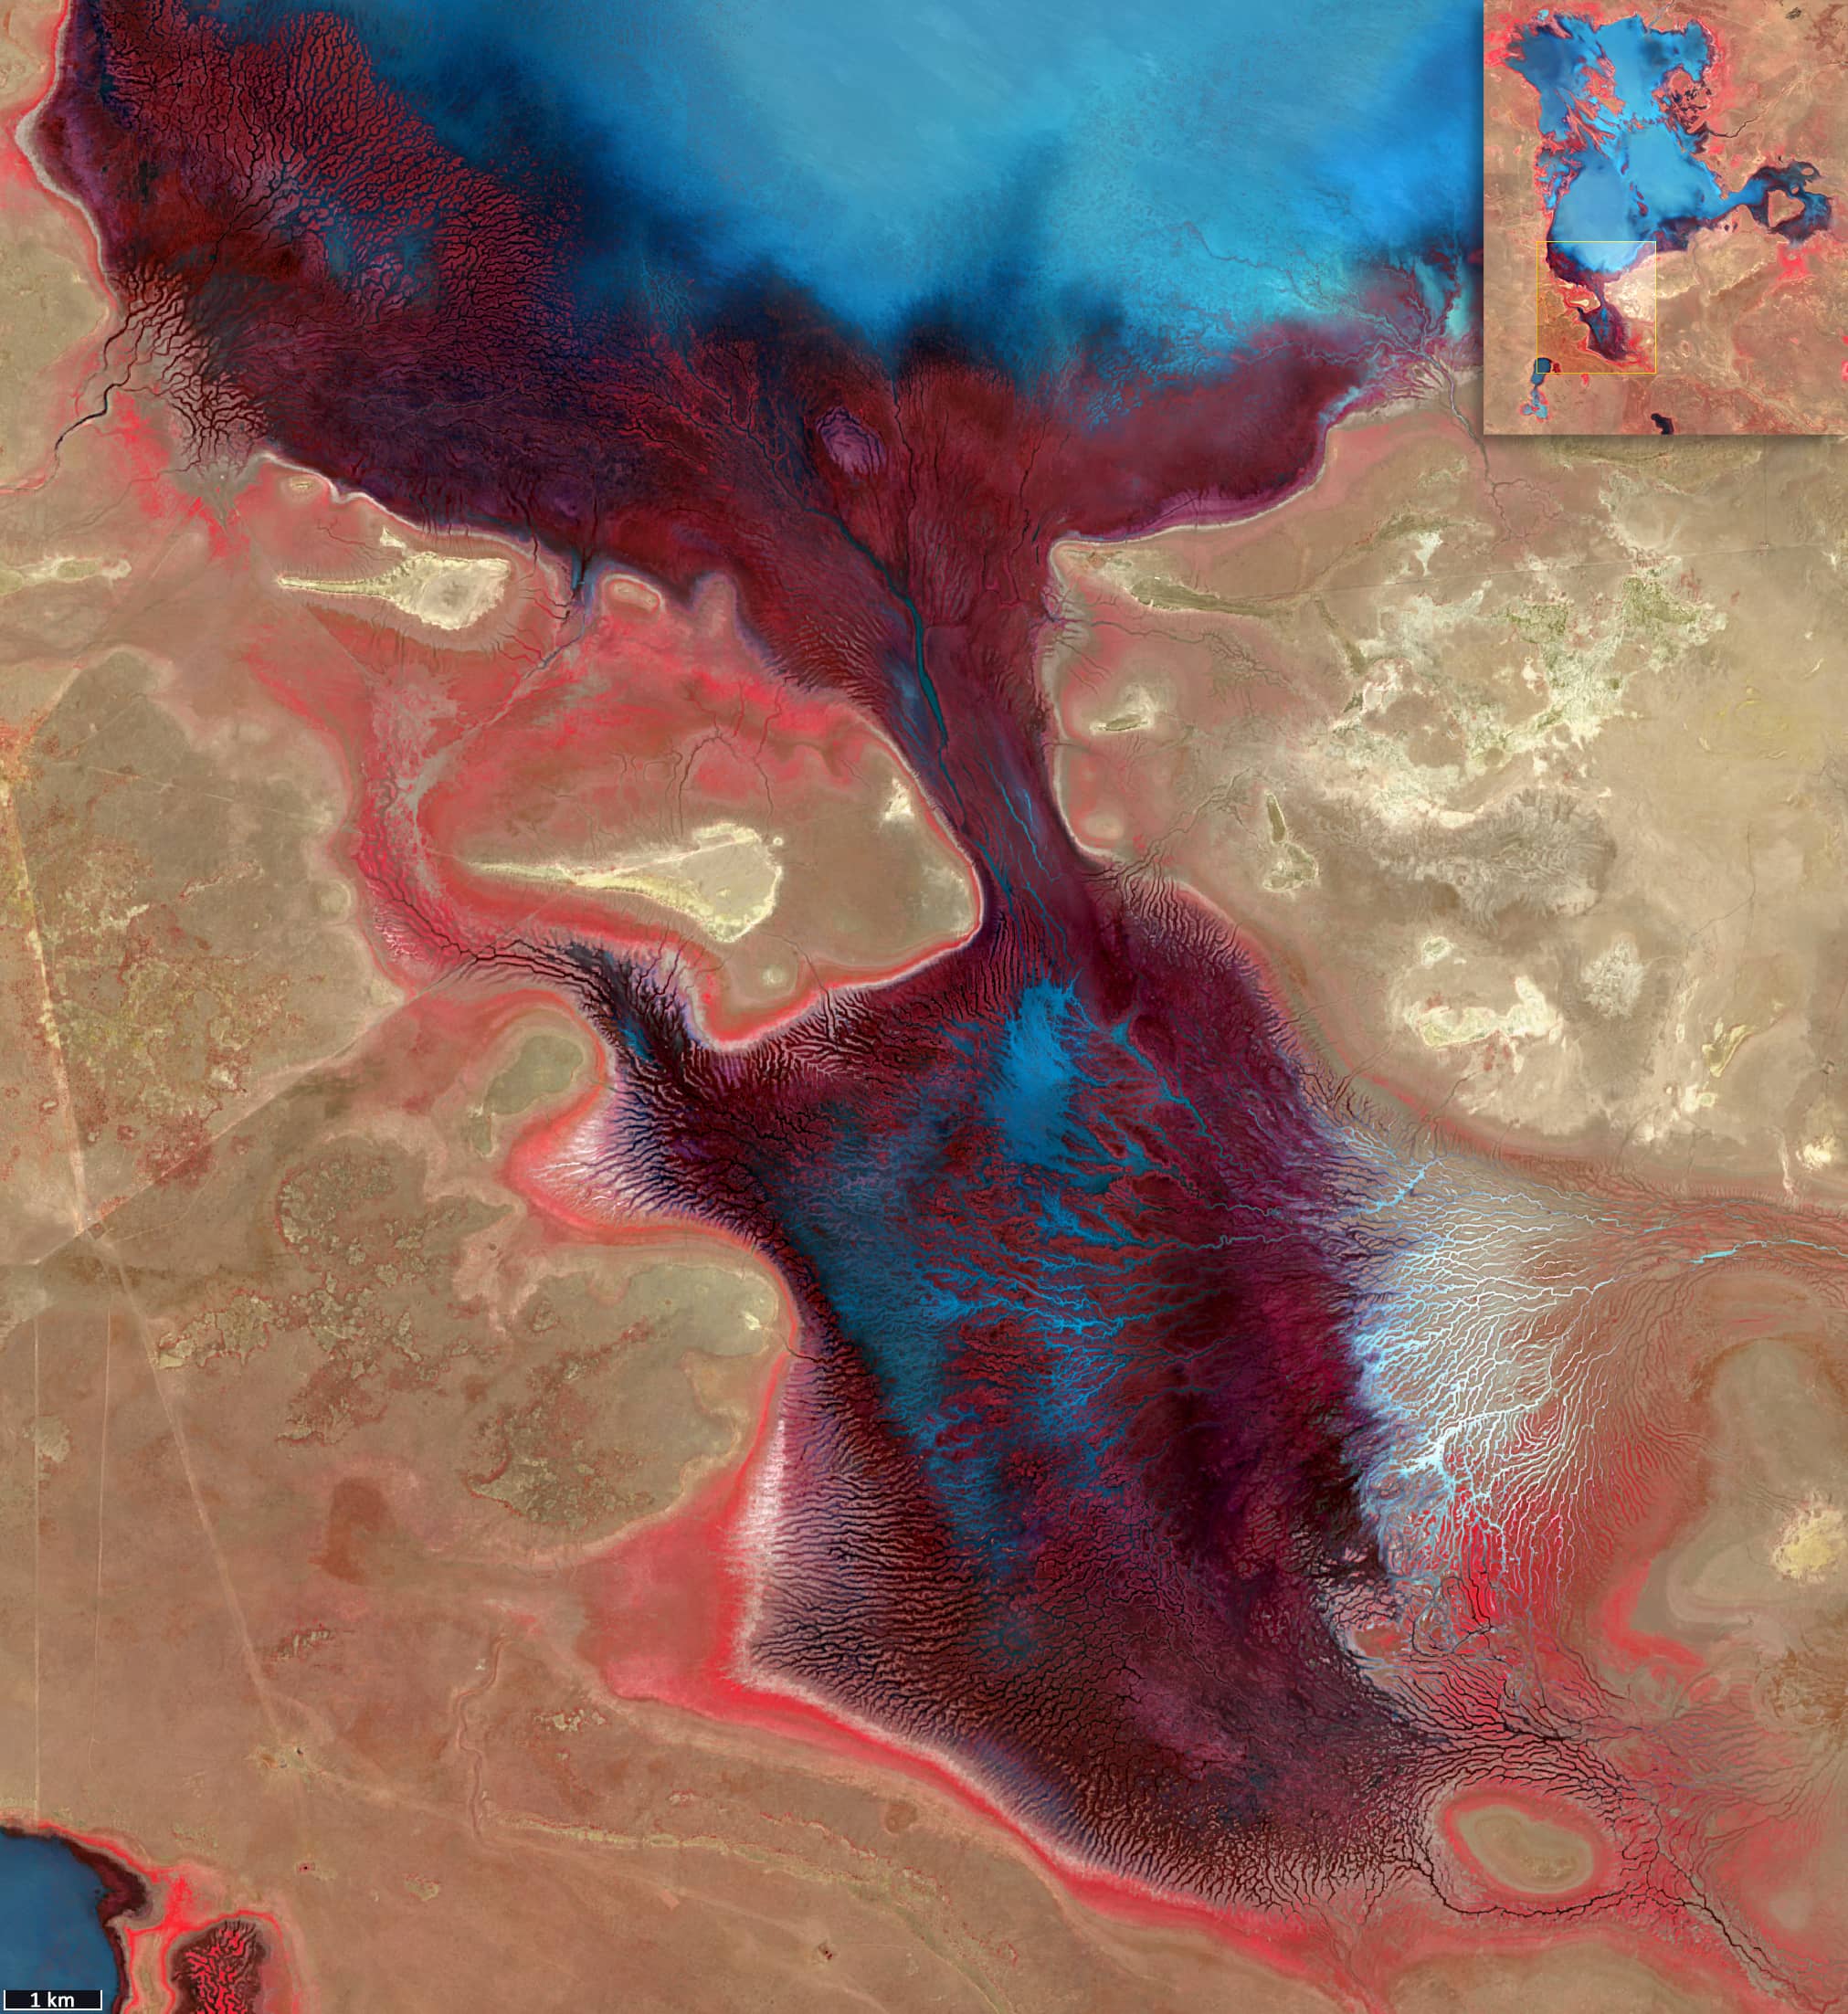
Fig. 2
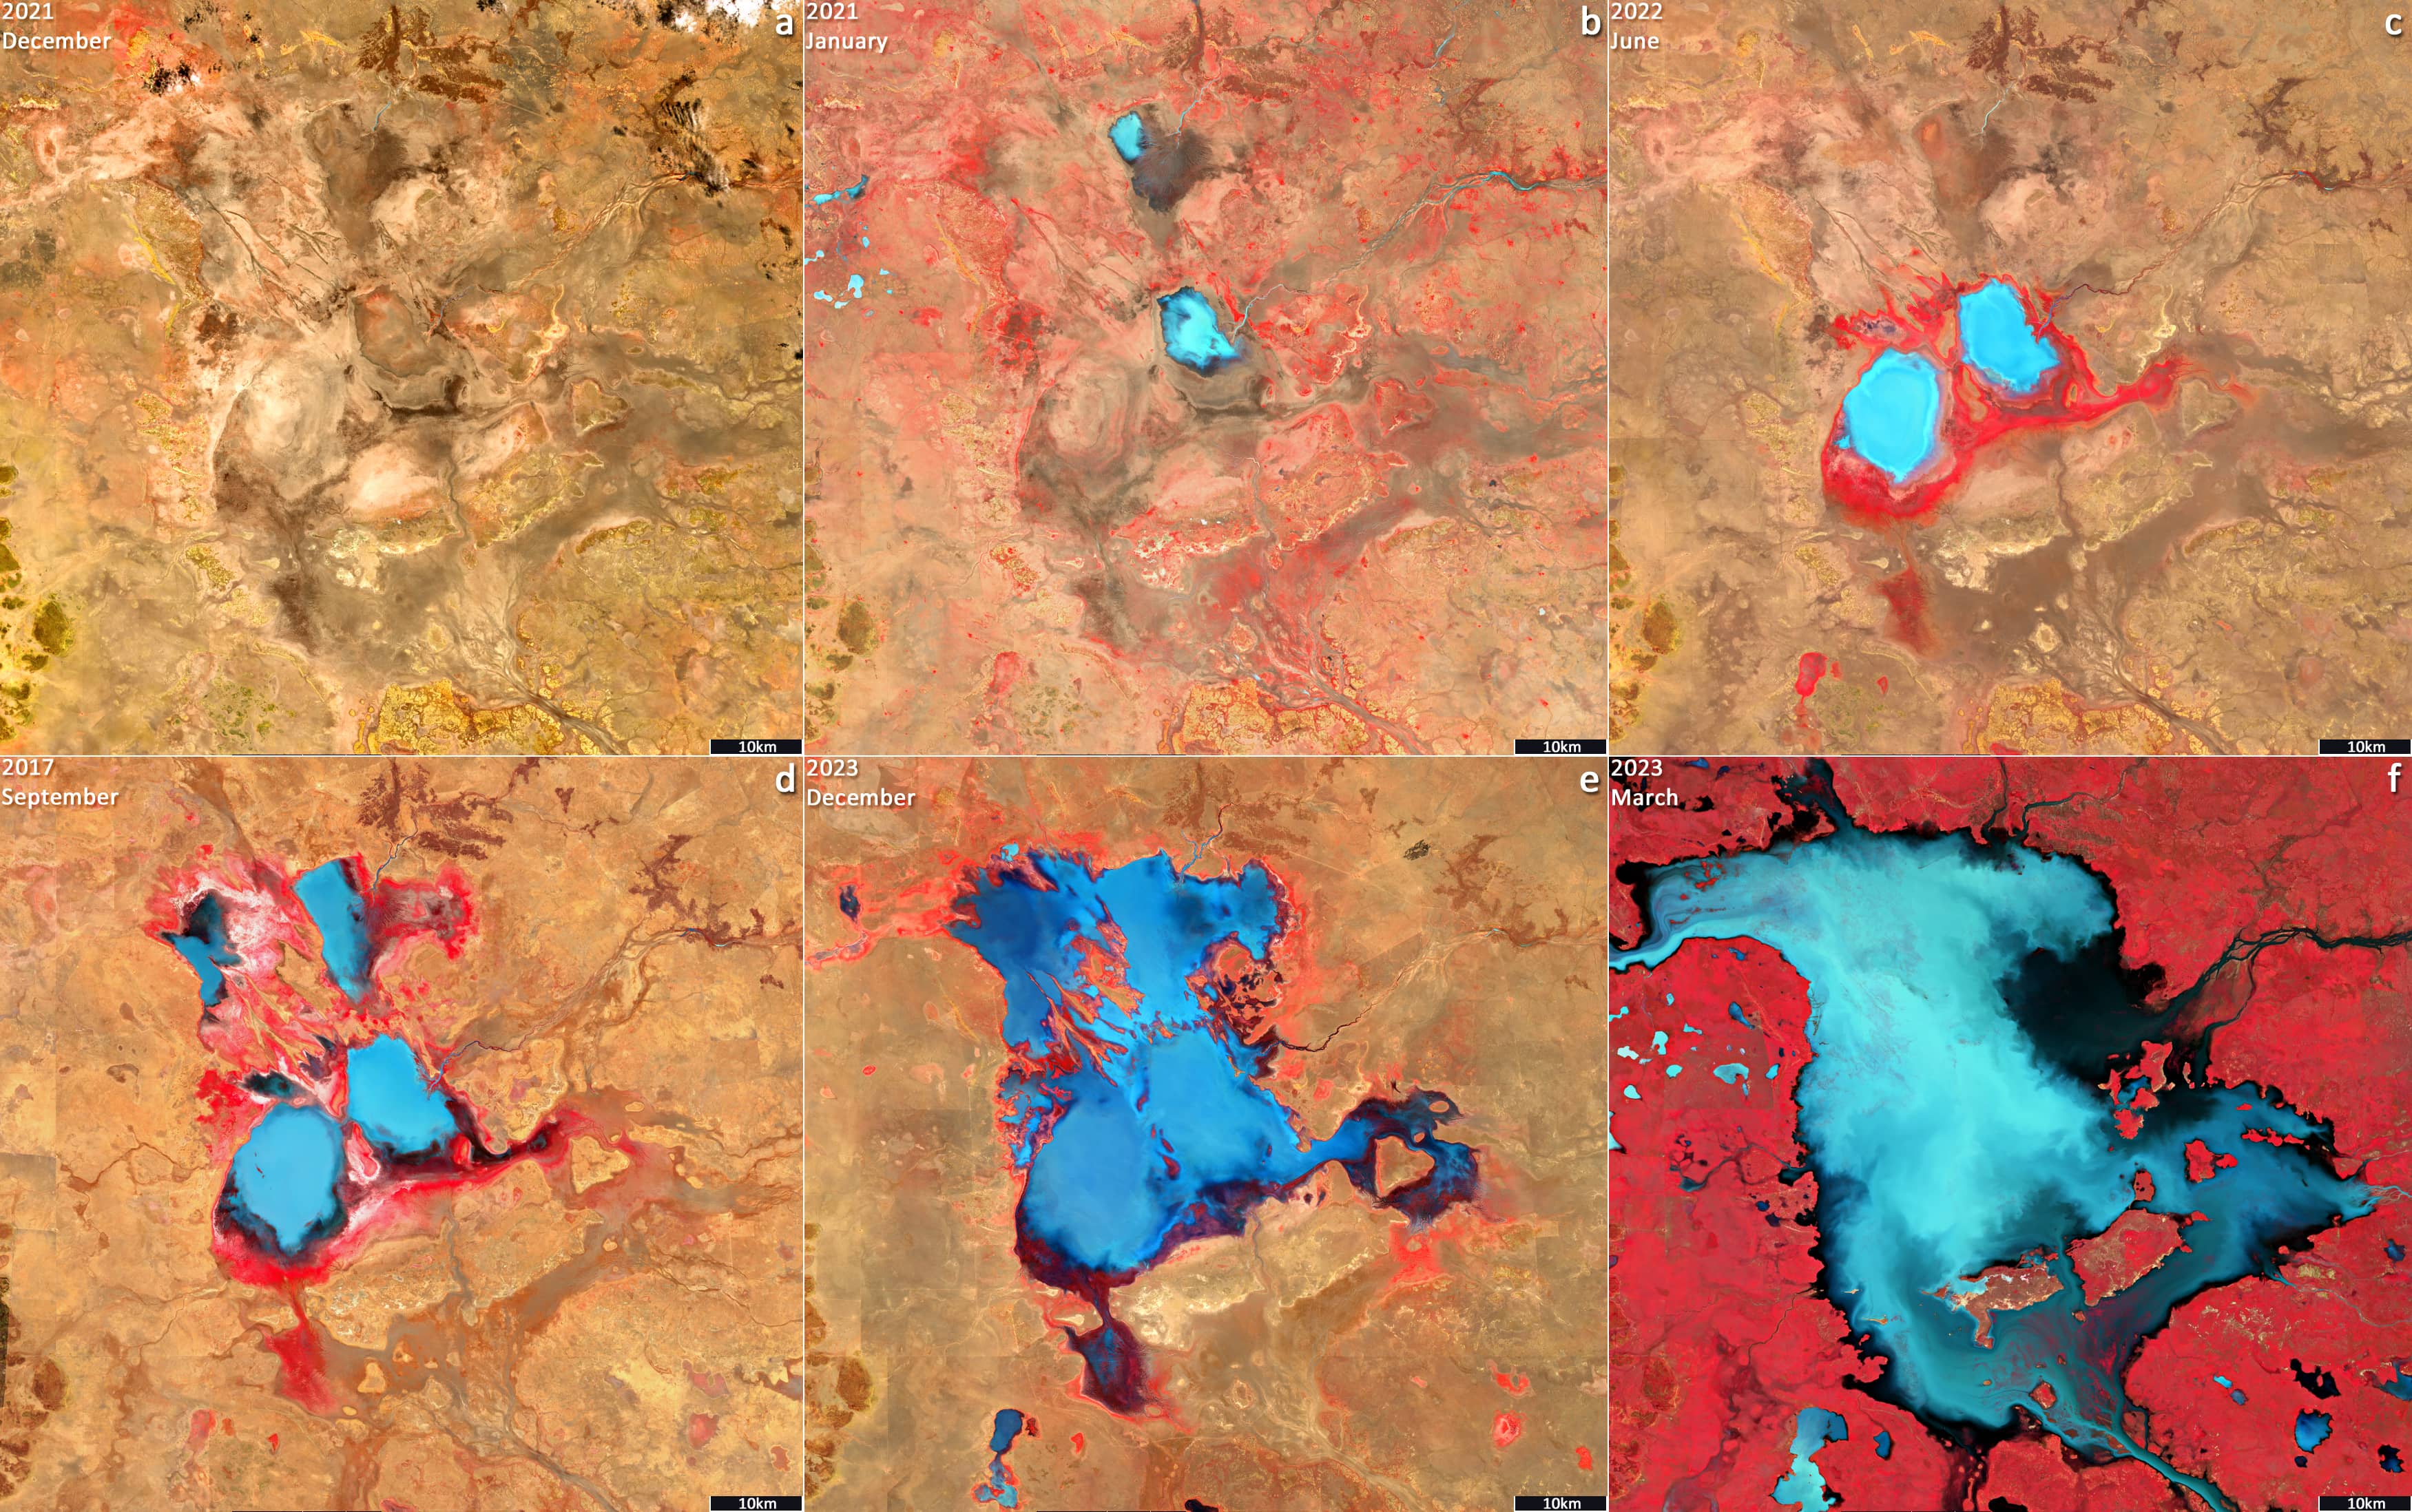
Fig. 3
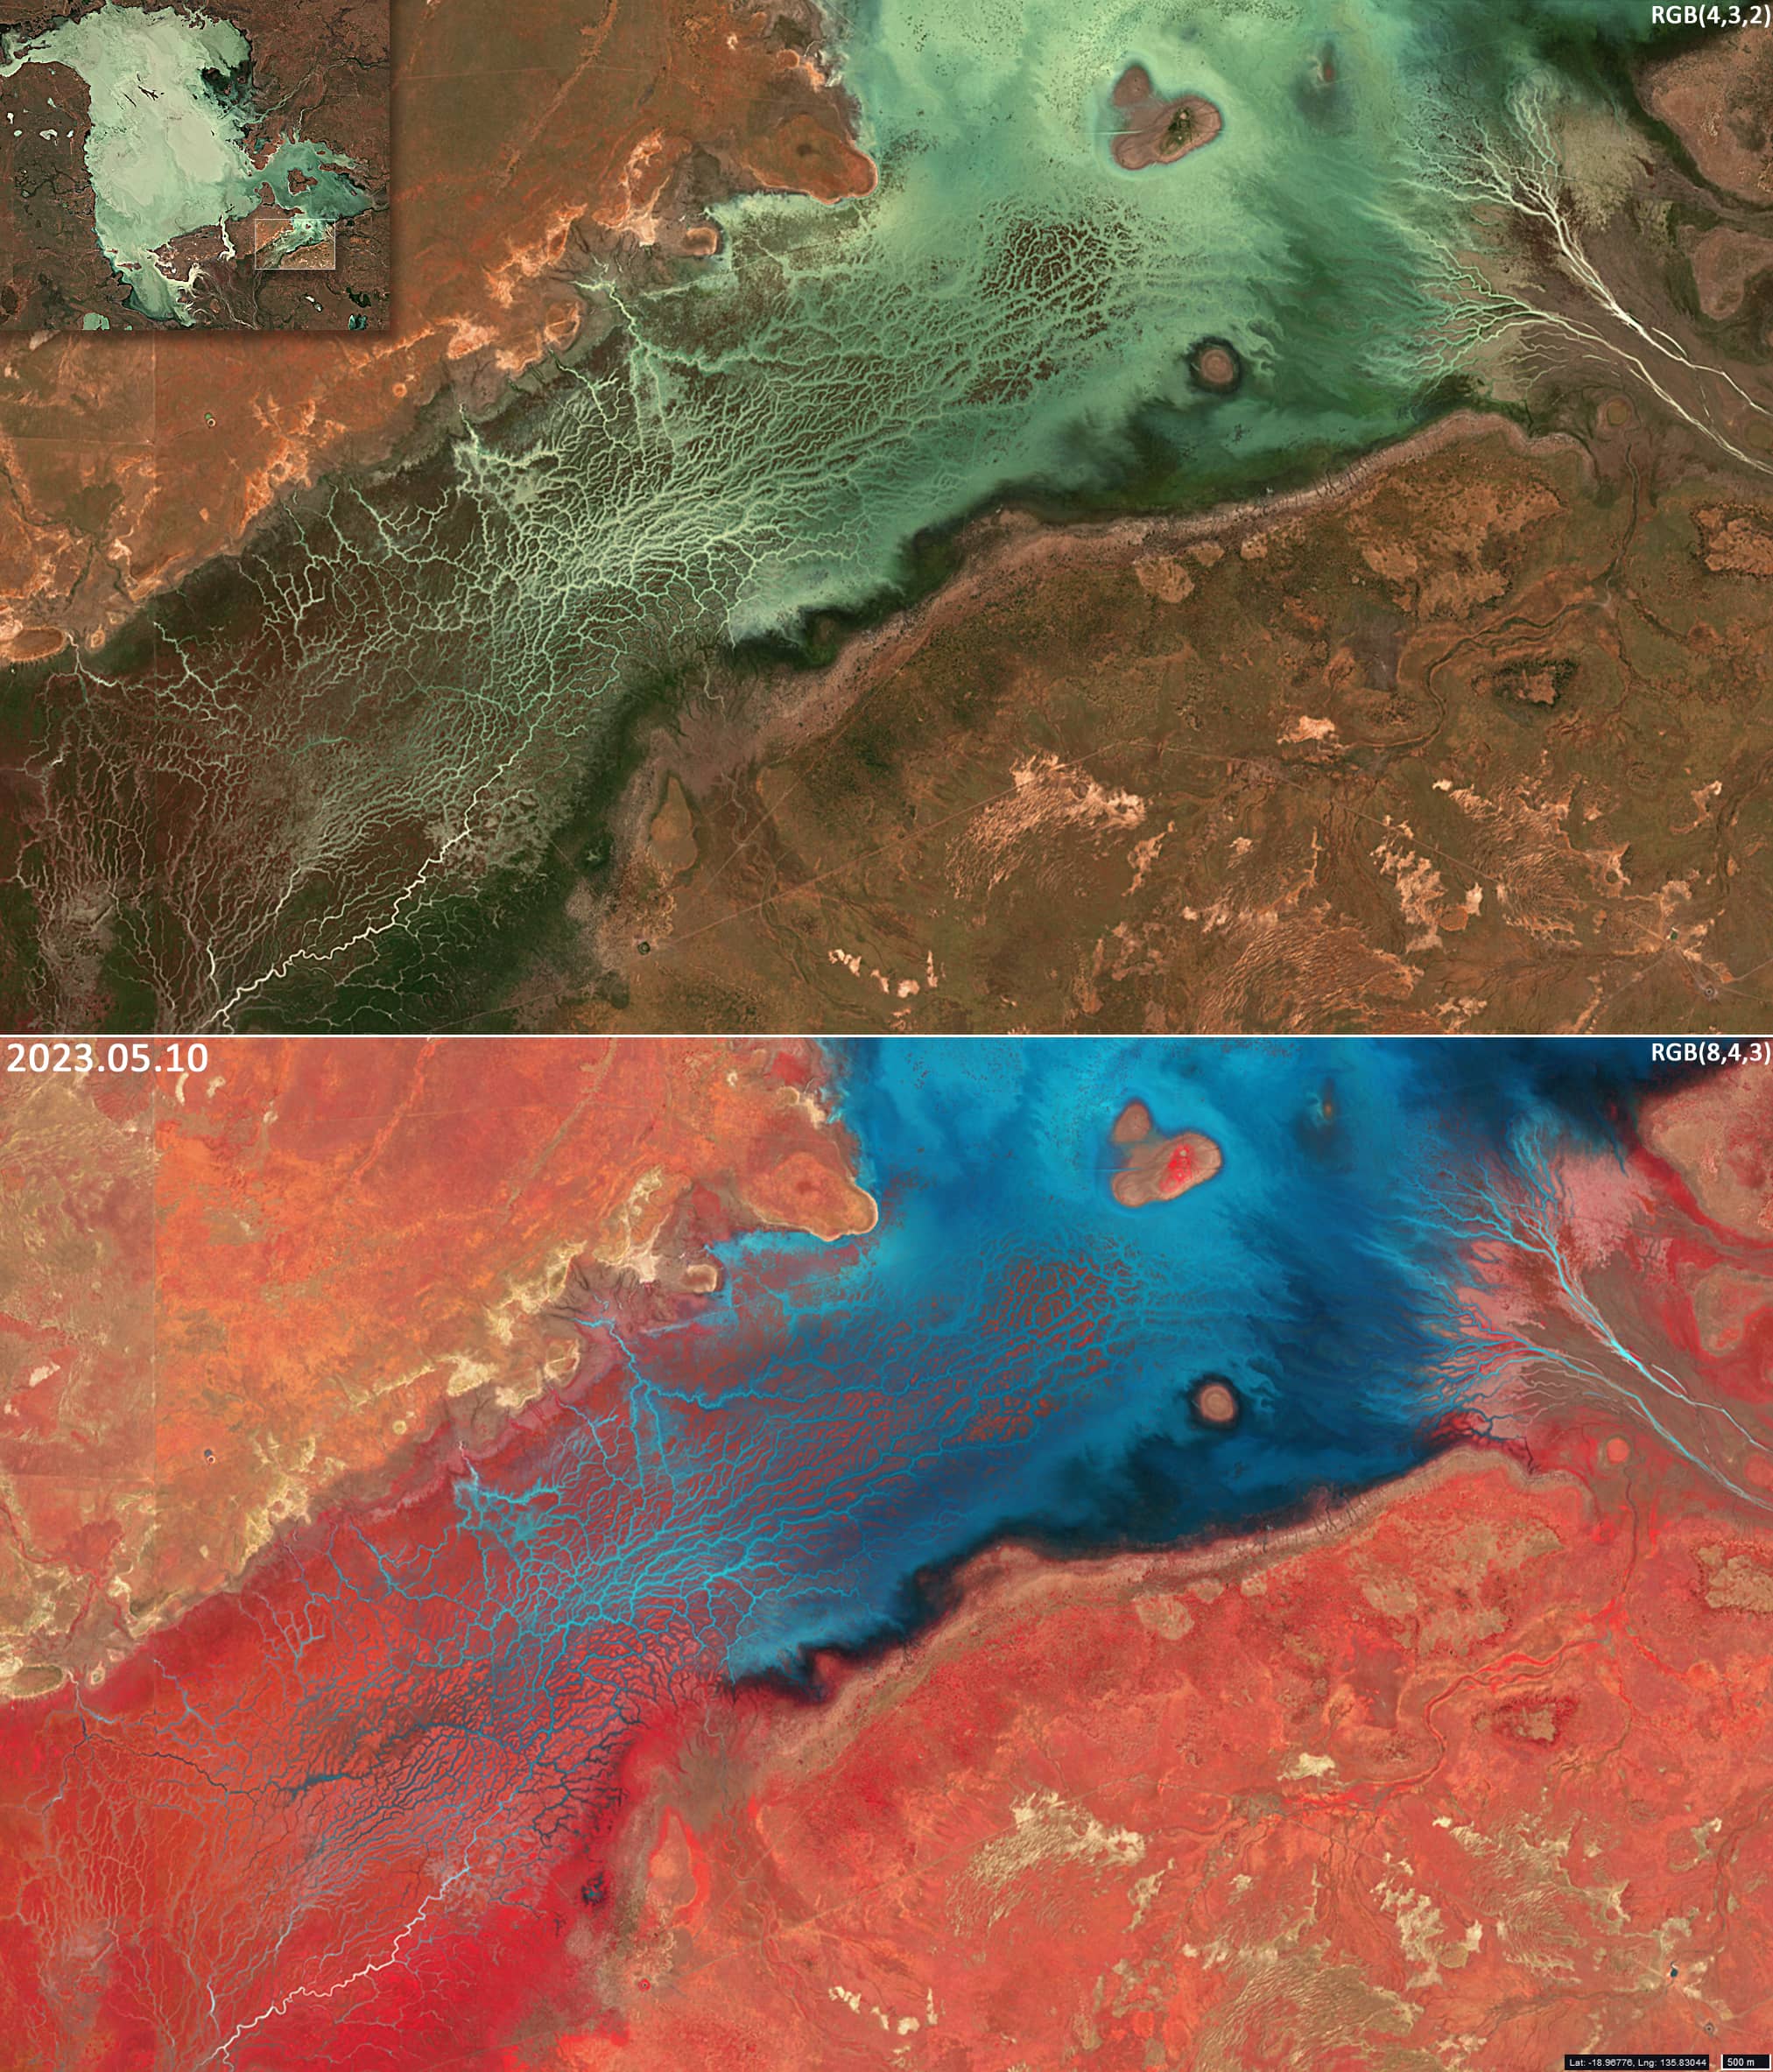
Fig. 4
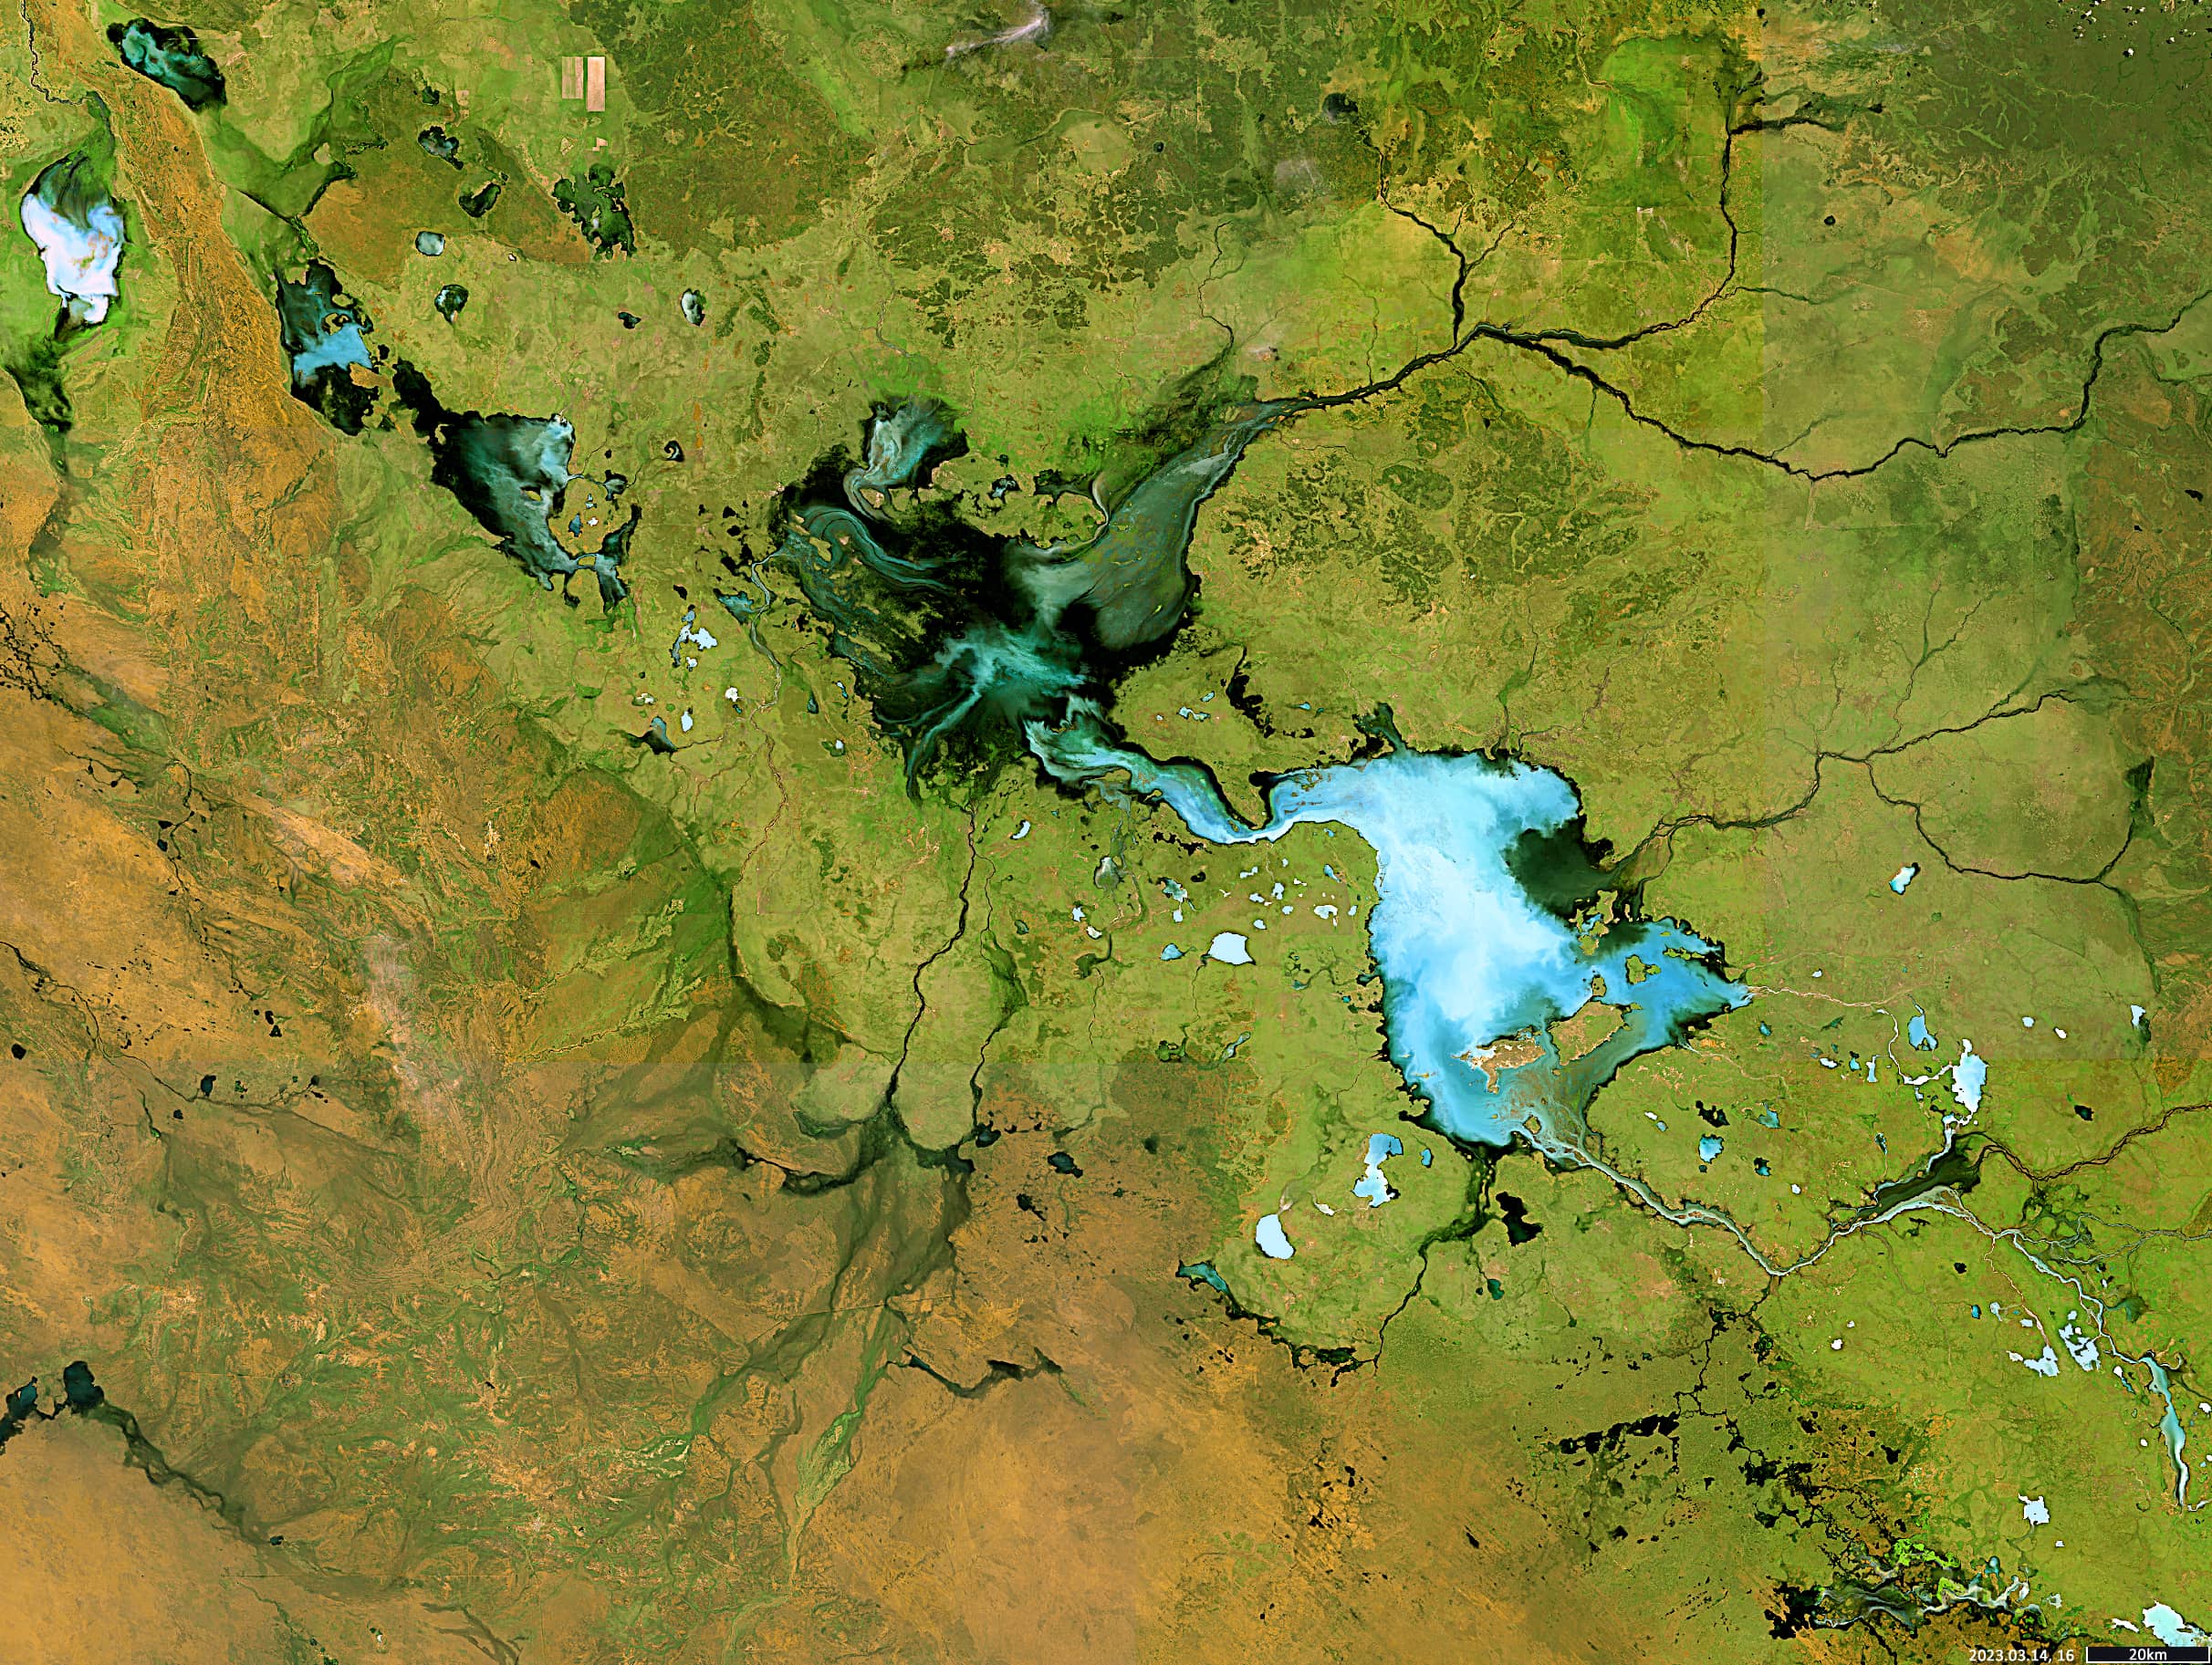
Fig. 5