Iceberg A23a
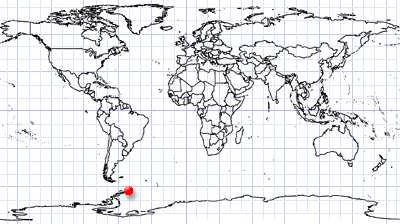
Weddell Sea | Northwest Antarctica
Dates of acquisition:
- December 9th, 2023 | 13:41:07 UTC
- December 2nd, 2023 | 12:20:18 UTC
- December 1st, 2023 | 23:11:53 UTC
- October 31st, 2023 | 12:50:02 UTC
Sensor: Sentinel-2 L2A, Sentinel-3A,B OLCI, Sentinel-1A AWS-EW-HH
Coordinates: ca. 62.31°S, 53.06°W
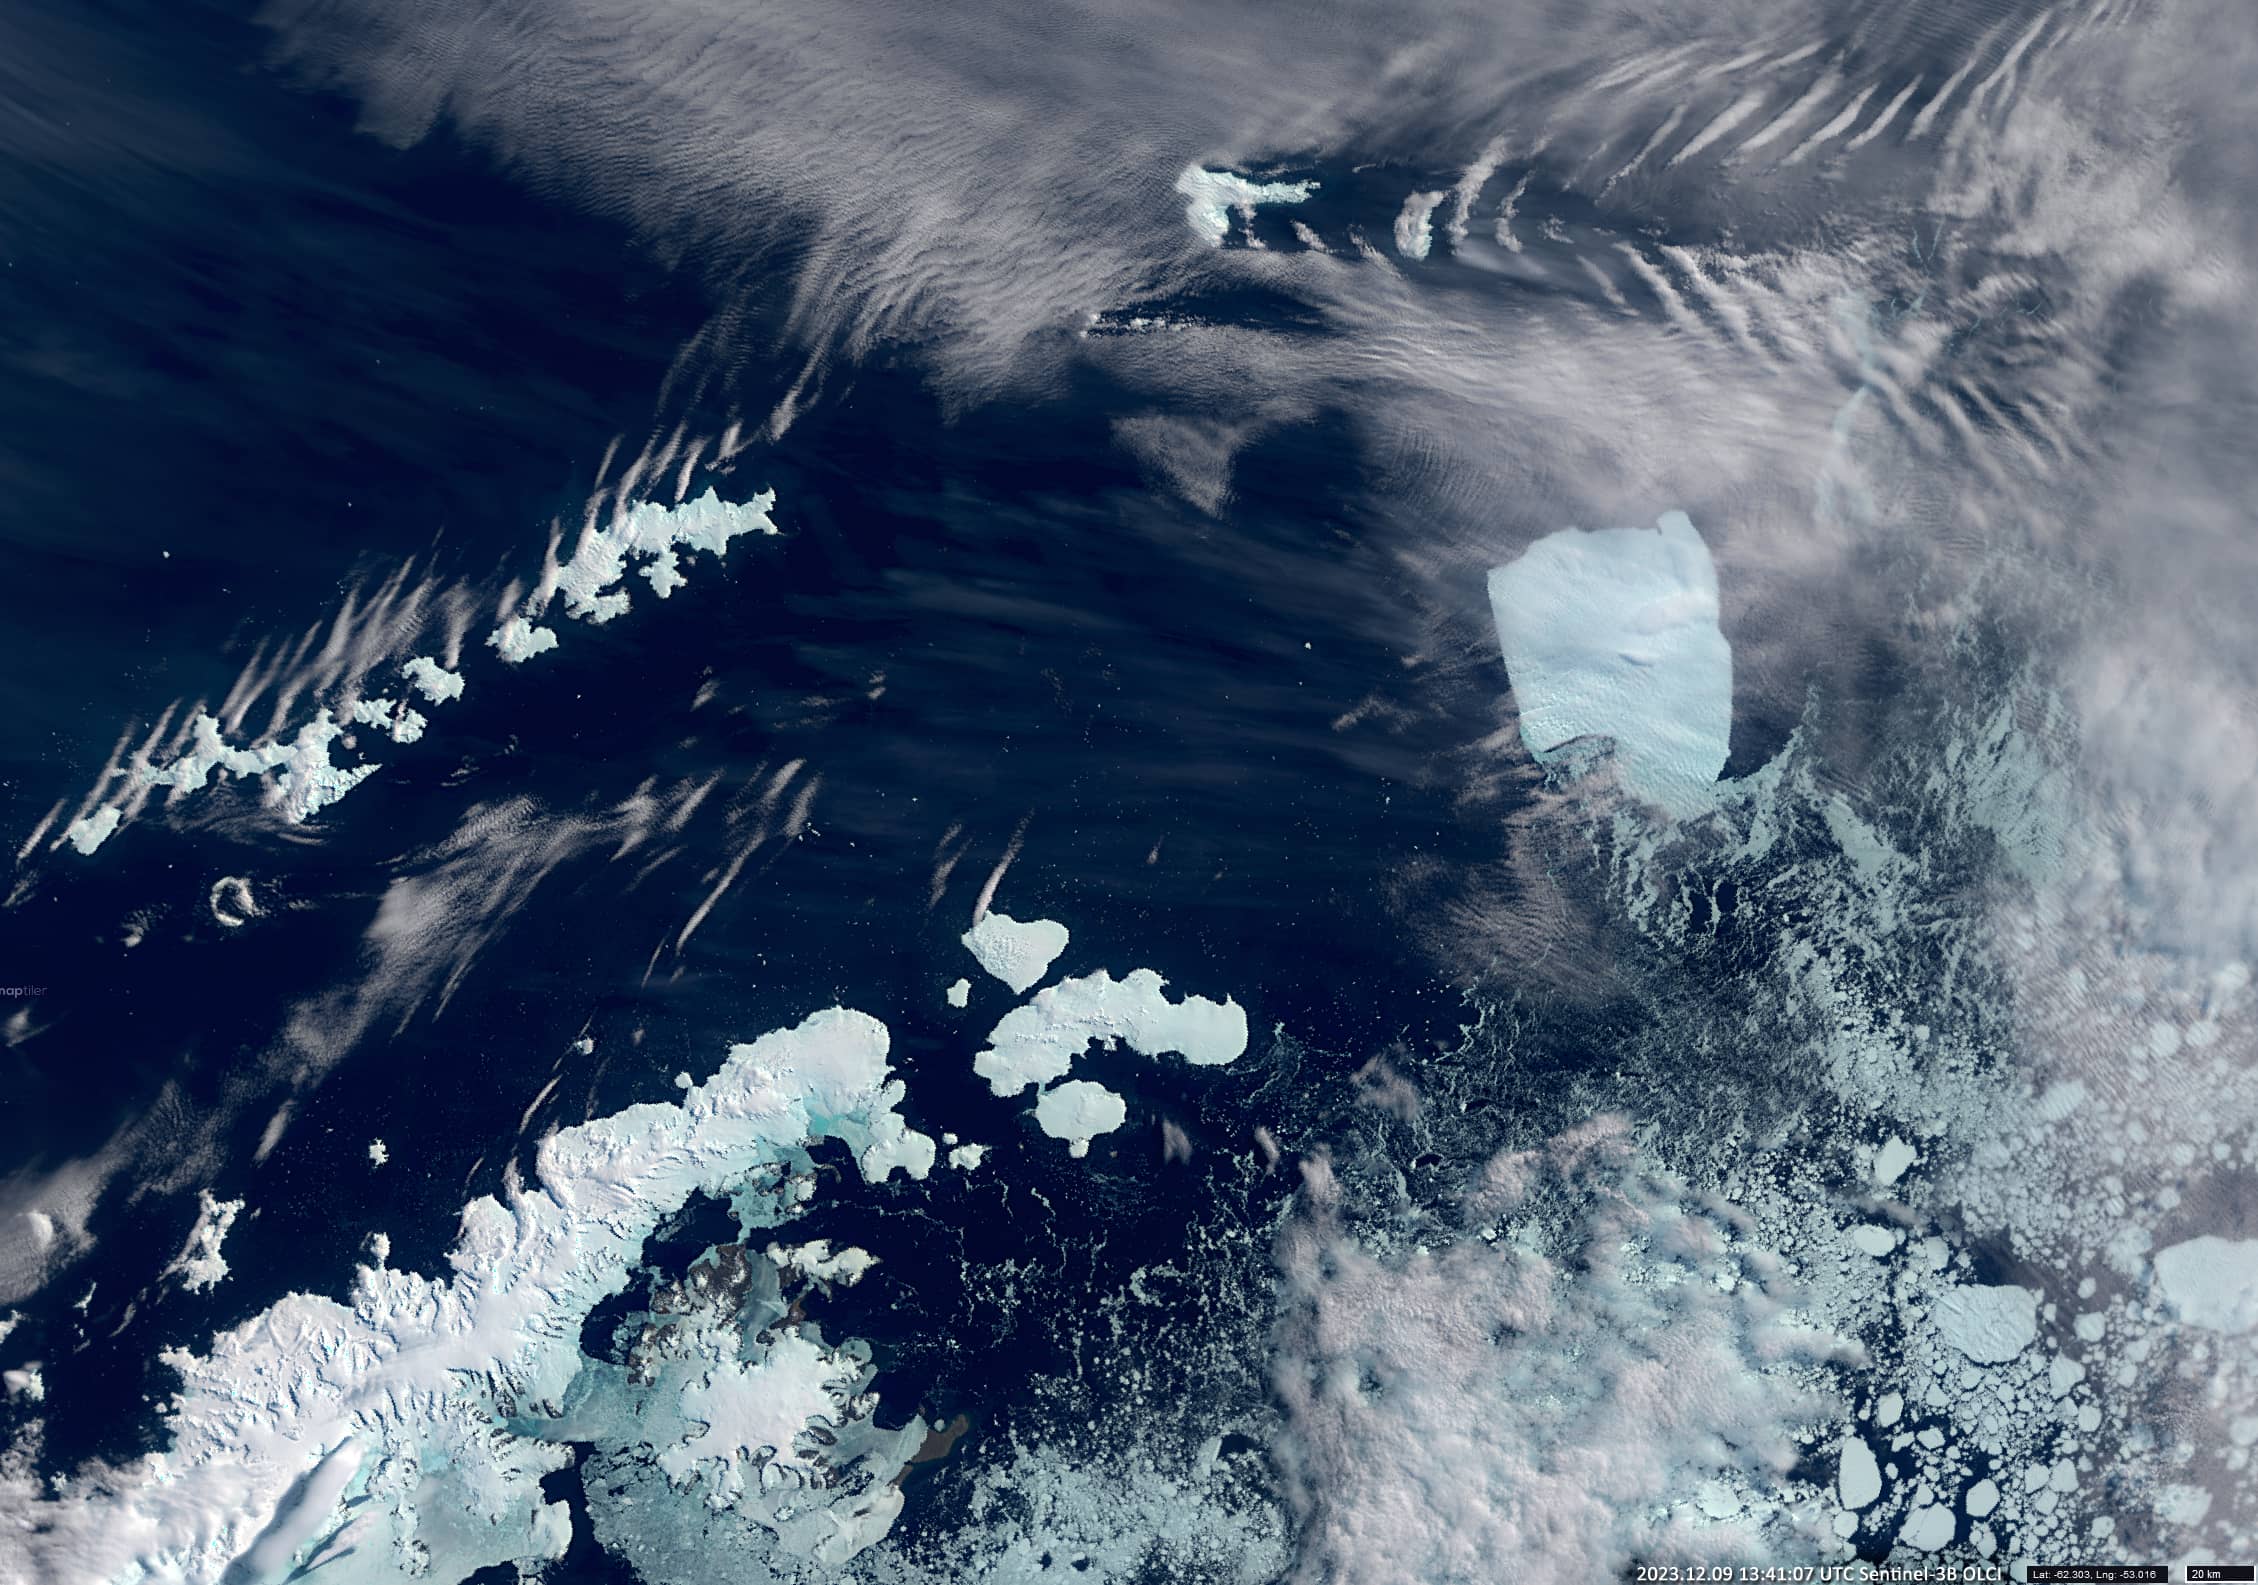
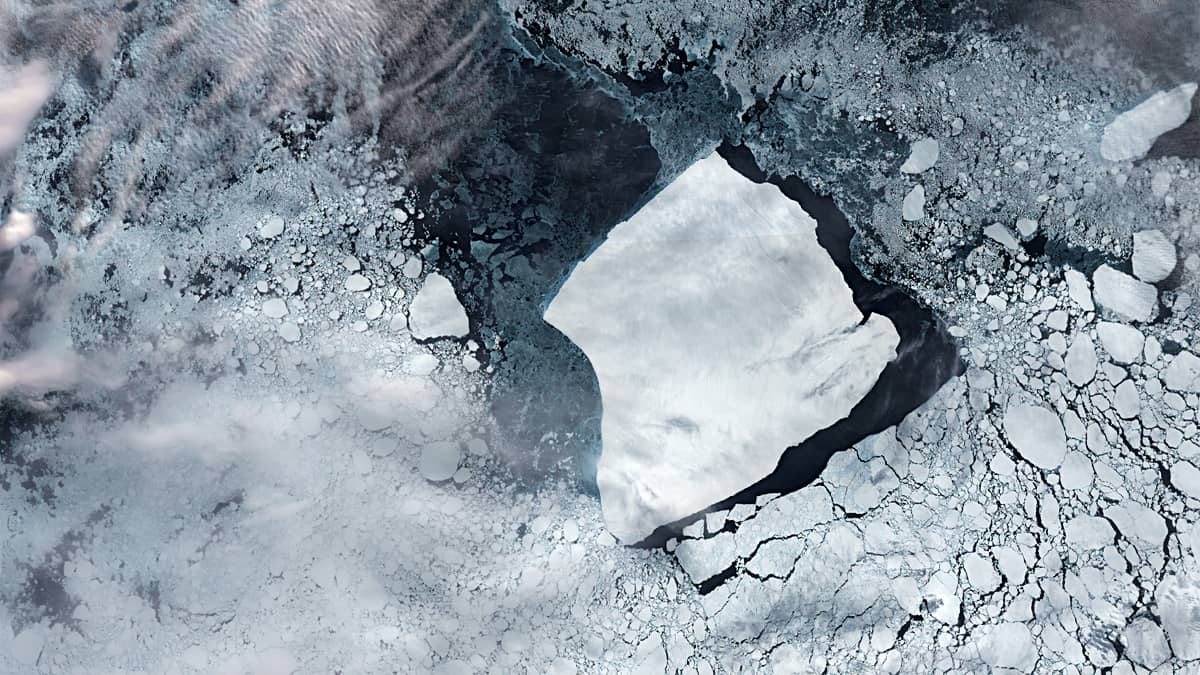
The Sentinel-3 satellite image (Figure 1) shows the world’s largest iceberg, labelled A23a (~62km × ~63km).
The iceberg formed in 1986 during one of the largest ice shelf break-offs in history: it broke off with several other pieces of ice from the Filchner Ice Shelf, the second largest ice shelf in Antarctica. After breaking off, the iceberg soon sank to the bottom of the Weddell Sea off the coast of West Antarctica where it remained attached to the seabed for 37 years.
As part of the ice shelf’s natural cycle of growth and melting, the iceberg eventually lost its grip on the seabed and began to move actively. This event occurred in 2020, when the main part of A23a became free and began to rotate clockwise at its south-eastern corner. A Soviet station “Druzhnaya 1”, established in late 1975, was located on the ice for about 10 years. When A23 broke off from the ice sheet and floated away in 1986, ”Druzhnaya 1” was still on it.
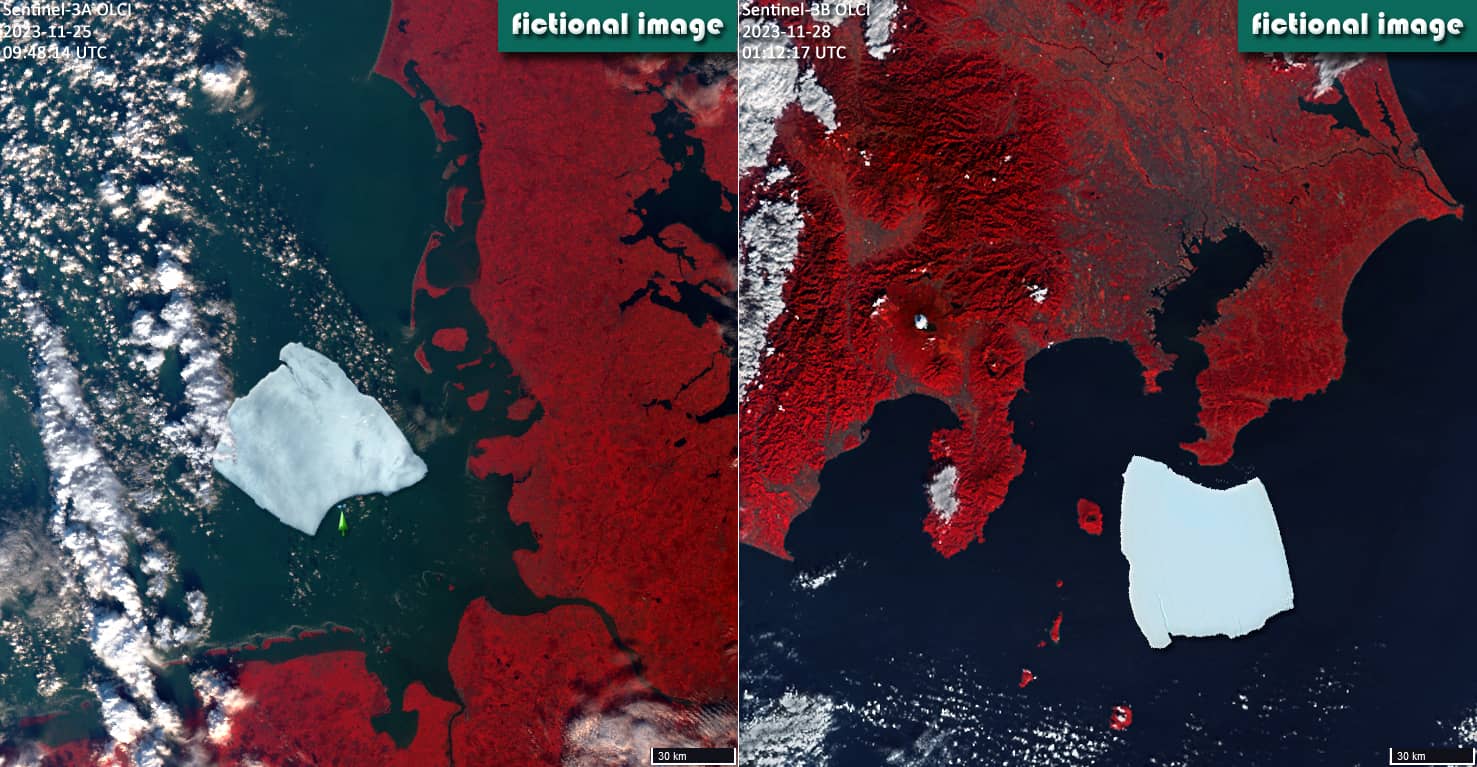
The thickness of A23a is now estimated to be around 400 meters and its area is almost four thousand square kilometers (~3.9×10³ km2), slightly more than the size of Mallorca. It is also more than four times the size of New York and 1.8 times the size of Tokyo. The volume of fresh water in the iceberg is approximately 1500-1600 km3, which is only slightly less than Lake Ontario in Canada. Figure 5 shows two fictitious images of what A23a would look like if it landed in the German Bight (green arrow points to the island of Helgoland) – on the left, or if it approached Japanese coast near Tokyo – on the right.
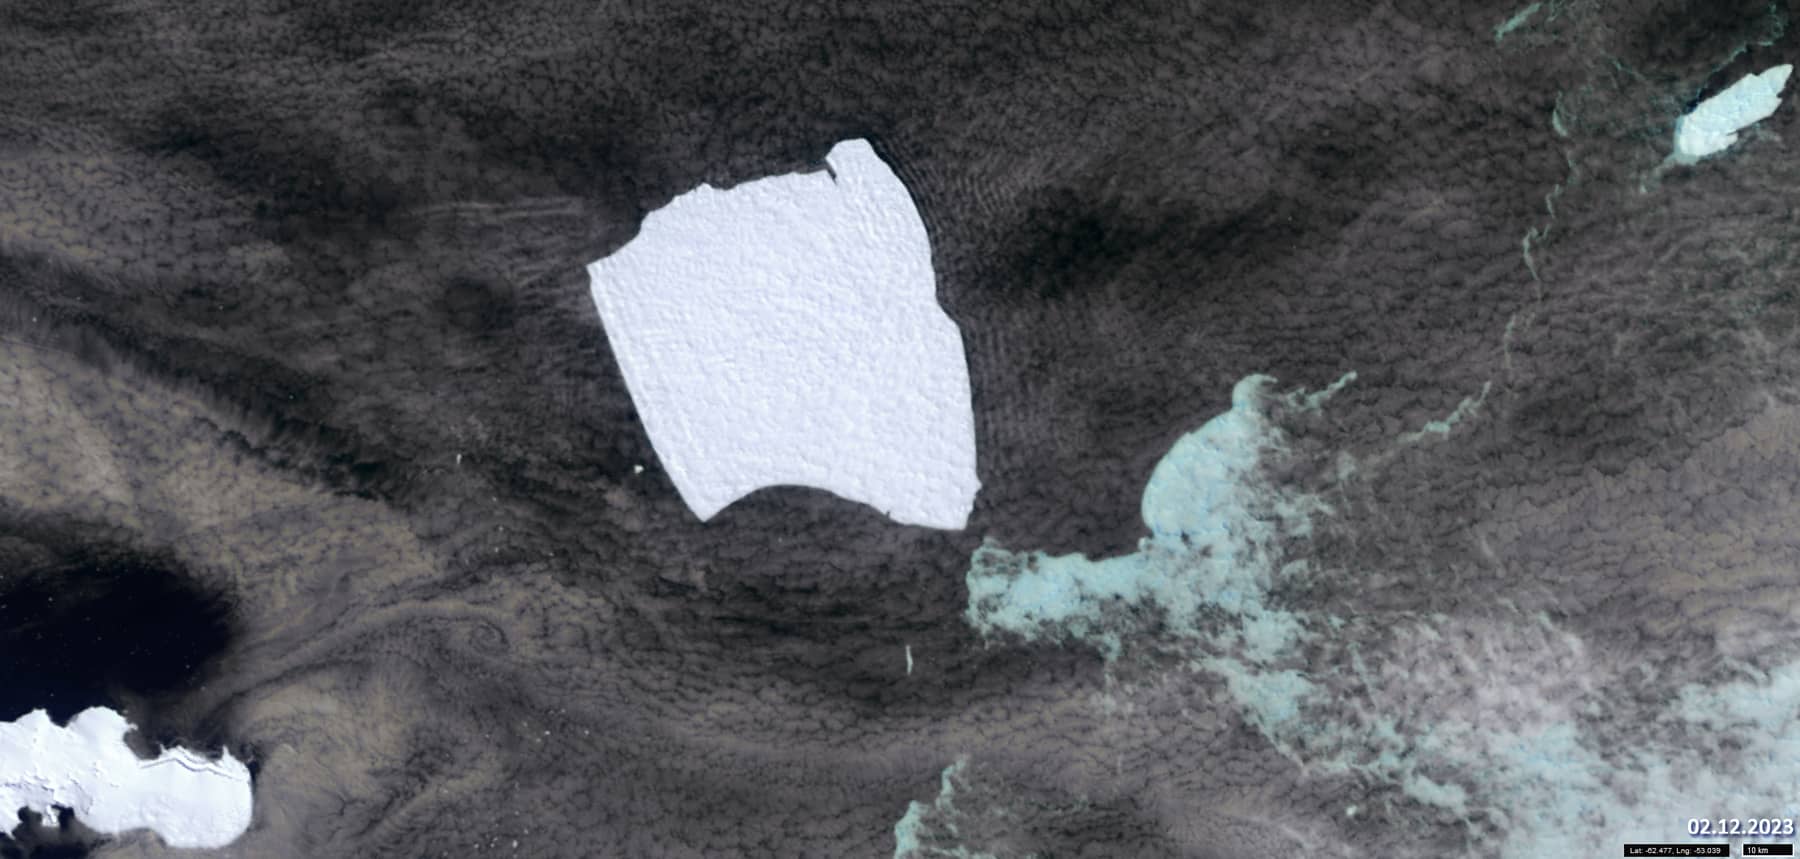
Although only a small part of the iceberg rises above the water (about 40 meters), it actively influences the behavior of the air masses above it. Figure 2 shows the different types of cloud structures above its windward and leeward sides.
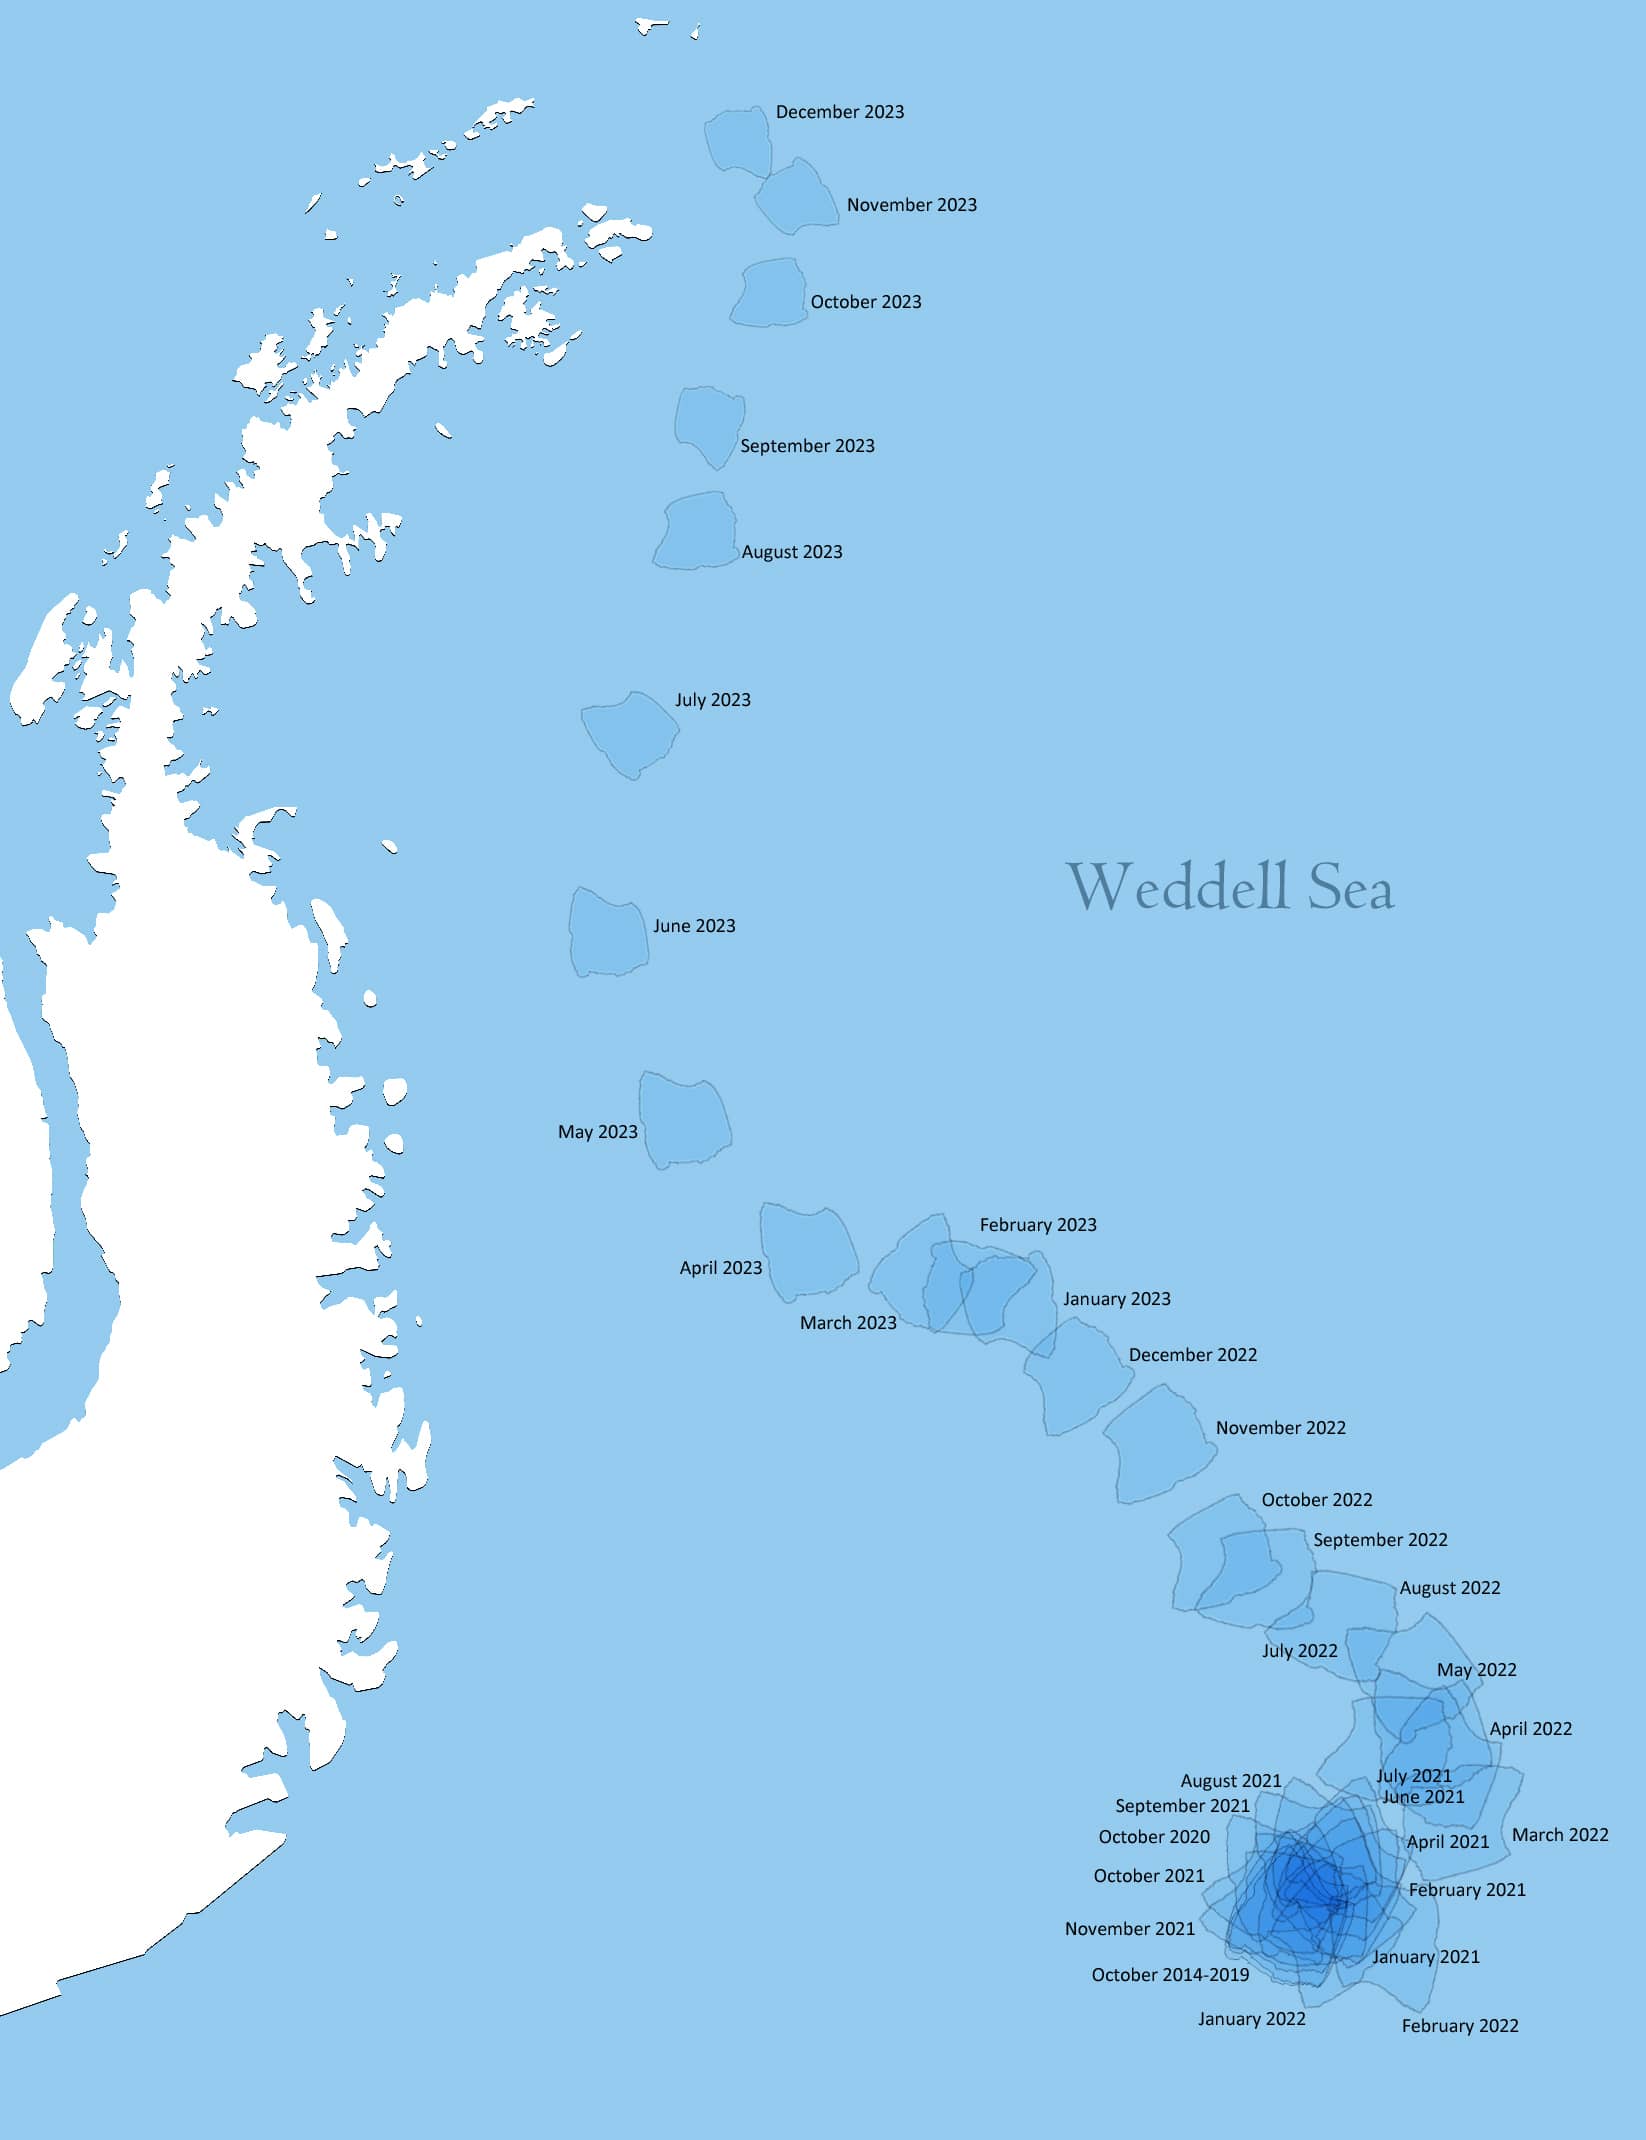
The graph (Figure 4) shows the movement of the iceberg through the Weddell Sea since 2014. The image was produced using Sentinel-1 and Sentinel-2 data available in Sentinel Hub. Its active movement began in early 2022.
The apparent decrease in size of the iceberg in the diagram as it moves northwards is caused by the Mercator projection at high latitudes (the scale in this projection is not constant, butincreases from the equator to the poles, like the inverse cosine of latitude).
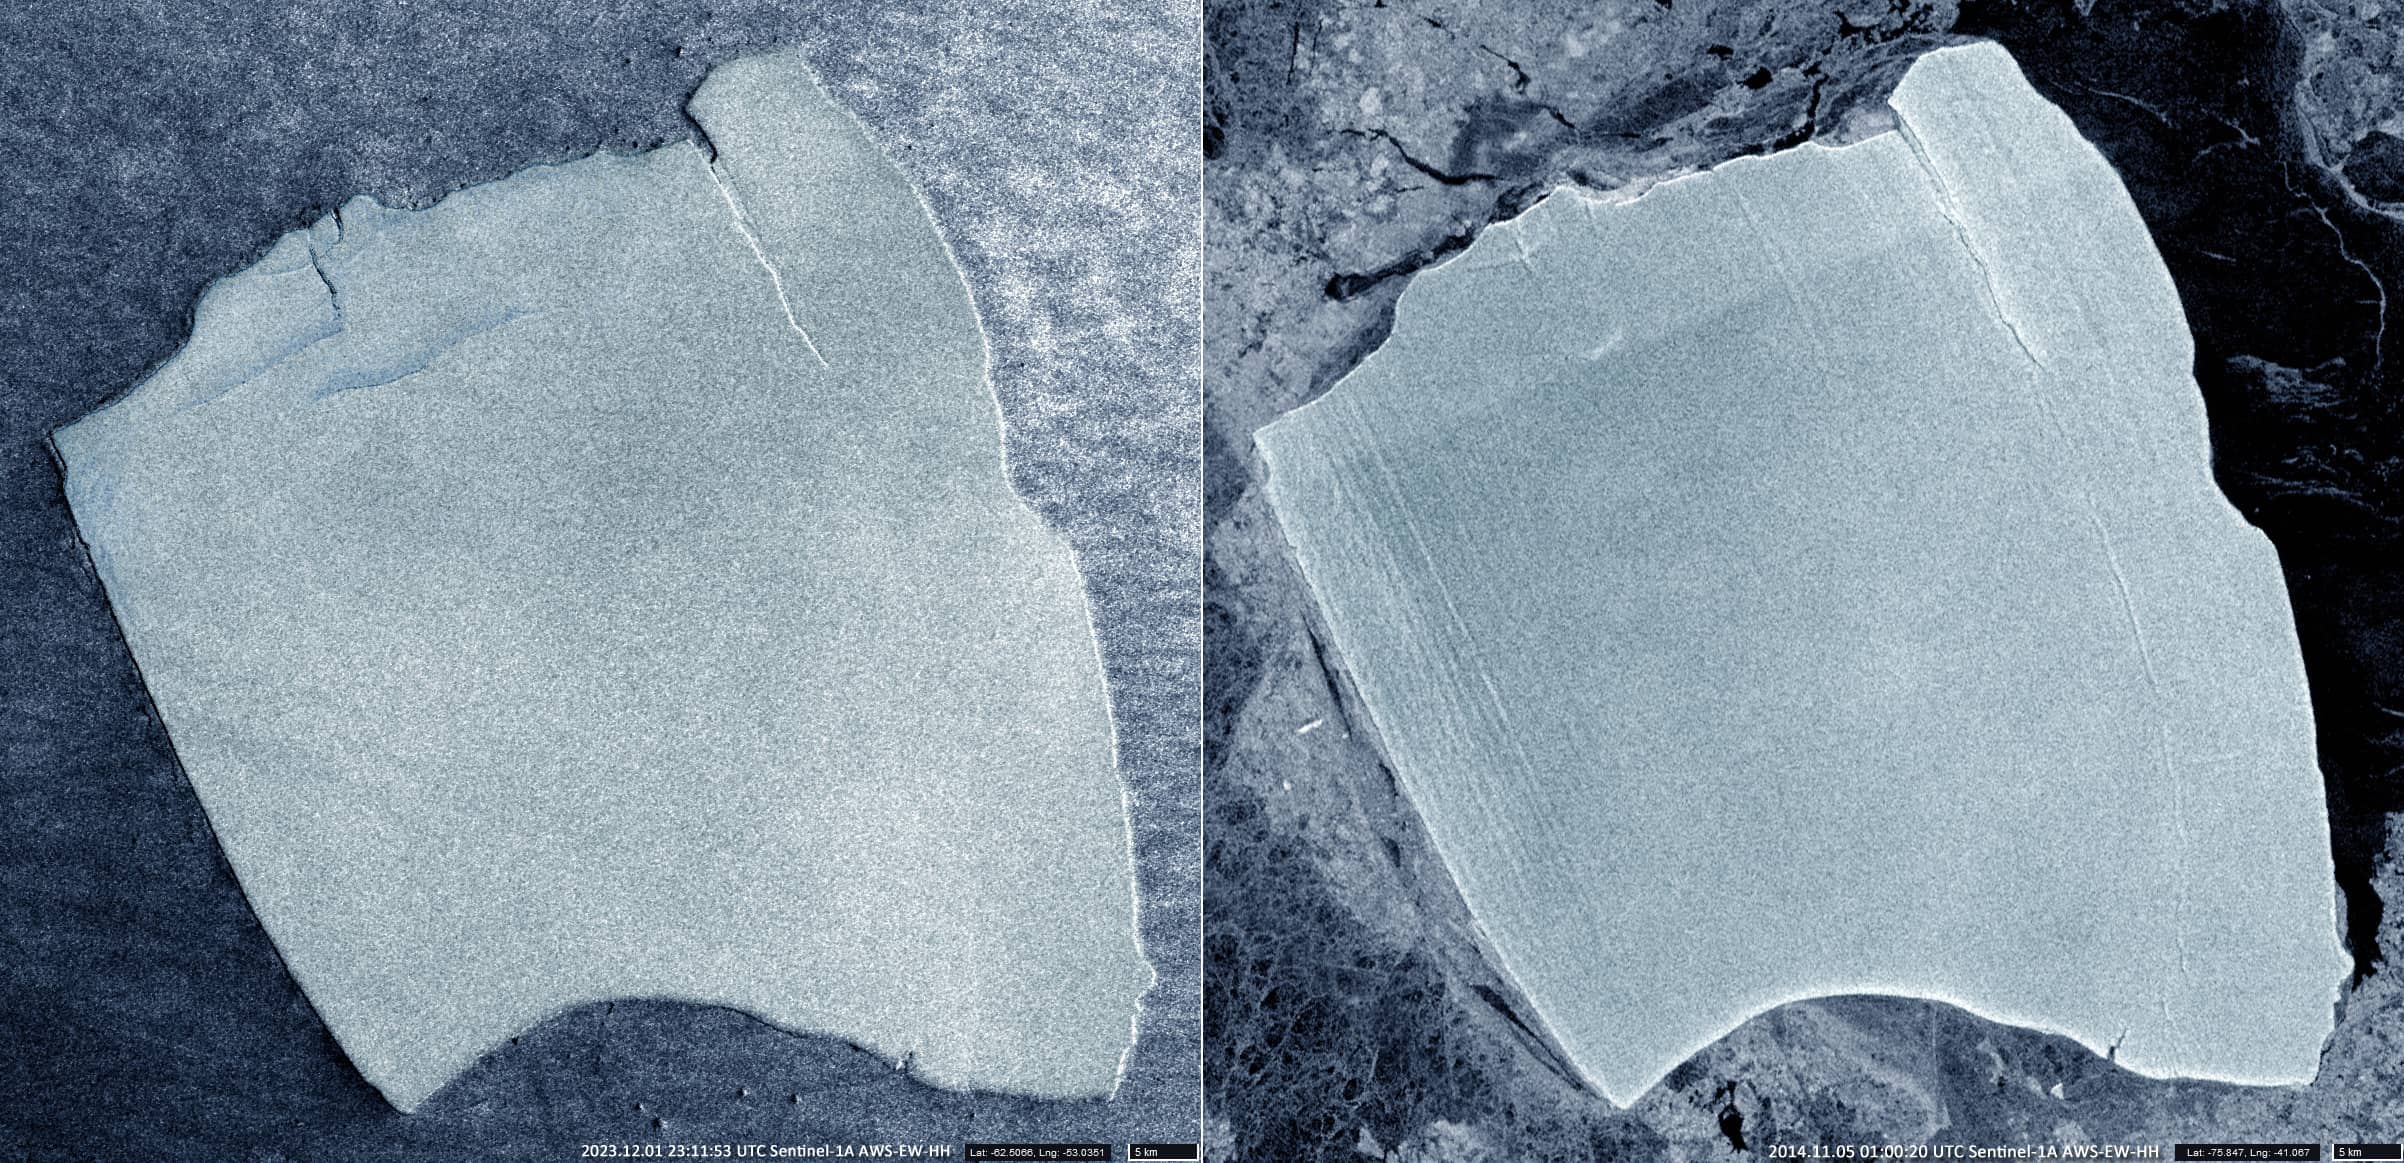
If we compare the current images of the iceberg with those from late 2014 (Figure 3), we can see that its appearance and size have remained visually unchanged over the past nine years.
It is assumed that the iceberg is most likely moving in a north-easterly direction, carried by ocean currents. Its actual (08.12.2023, 2023.12.08, 23:03:47 UTC) centre position is 62.3056°S, 53.0598°W.