Severe flooding in Mozambique
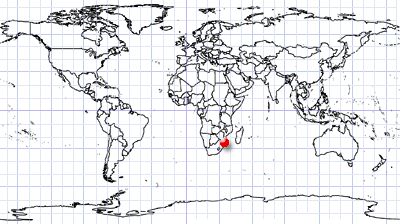
Gaza Province | Southeast Mozambique
Dates of acquisition:
• 2025.12.05 | 07:32:09 UTC
• 2026.01.27 | 07:40:59 UTC
• 2026.01.29 | 07:31:41 UTC
• 2026.02.08 | 07:30:51 UTC
Sensor: Sentinel-2B, C L2A
Coordinates: ca. 25°S, 34°E
The population of Mozambique’s Gaza Province was hit by severe flooding in December and January. Several weeks of heavy rainfall – with some areas receiving up to 700 mm in less than a week – led to a rapid water levels rise in the rivers. This resulted in the banks overflowing and adjacent floodplains being inundated, which allowed the floodwaters to penetrate densely populated areas. According to reports, at least 180,000 hectares of farmland were flooded, with more than 150,000 heads of livestock killed. The disaster has displaced hundreds of thousands of people and destroyed or damaged at least 30,000 homes.
Emergency evacuations to higher ground were carried out due to the increased risk of crocodile attacks in the flooded areas. The floods had driven crocodiles out of their natural habitats in South Africa and towards the mouth of the Limpopo River.
The flooding continued in several regions until mid-February. Meanwhile, water levels gradually receded, exposing agricultural land and infrastructure.
With an area of 75,709 km2 and a population of 1,422,460 according to the 2017 census, the Gaza Province is the least populated province in Mozambique. The provincial capital is Xai-Xai. The lower Limpopo River and its mouth are located here. The Crocodile River, the longest tributary of the Limpopo, is located in South Africa.
Satellite images, visualized using the near-infrared (NIR) spectral bands in the image provide a particularly clear visualization of flood conditions. In these false-colour composite images, vegetation appears red due to its high reflectance in the NIR range, while water bodies appear in shades of green to blue, depending on the concentration of suspended sediment. Darker areas indicate zones of increased soil moisture or surface water saturation.
Images from the Sentinel-2 satellite mission clearly illustrate the difference between the normal conditions on the Limpopo River in early December 2025 (Figure 1) and the flooding observed in January and February 2026 (Figures 2 and 3). The images reveal how the floodwaters gradually receded by February, exposing higher-lying areas while leaving water in topographical depressions and low-lying floodplain areas.
Figure 4 sshows enlarged sections of the area surrounding the city of Xai-Xai during the dry season and during the flood event. These sections are shown in true-colour (visible spectrum) composites as well as in near-infrared composites, enabling a comparative assessment of hydrological and vegetative dynamics.
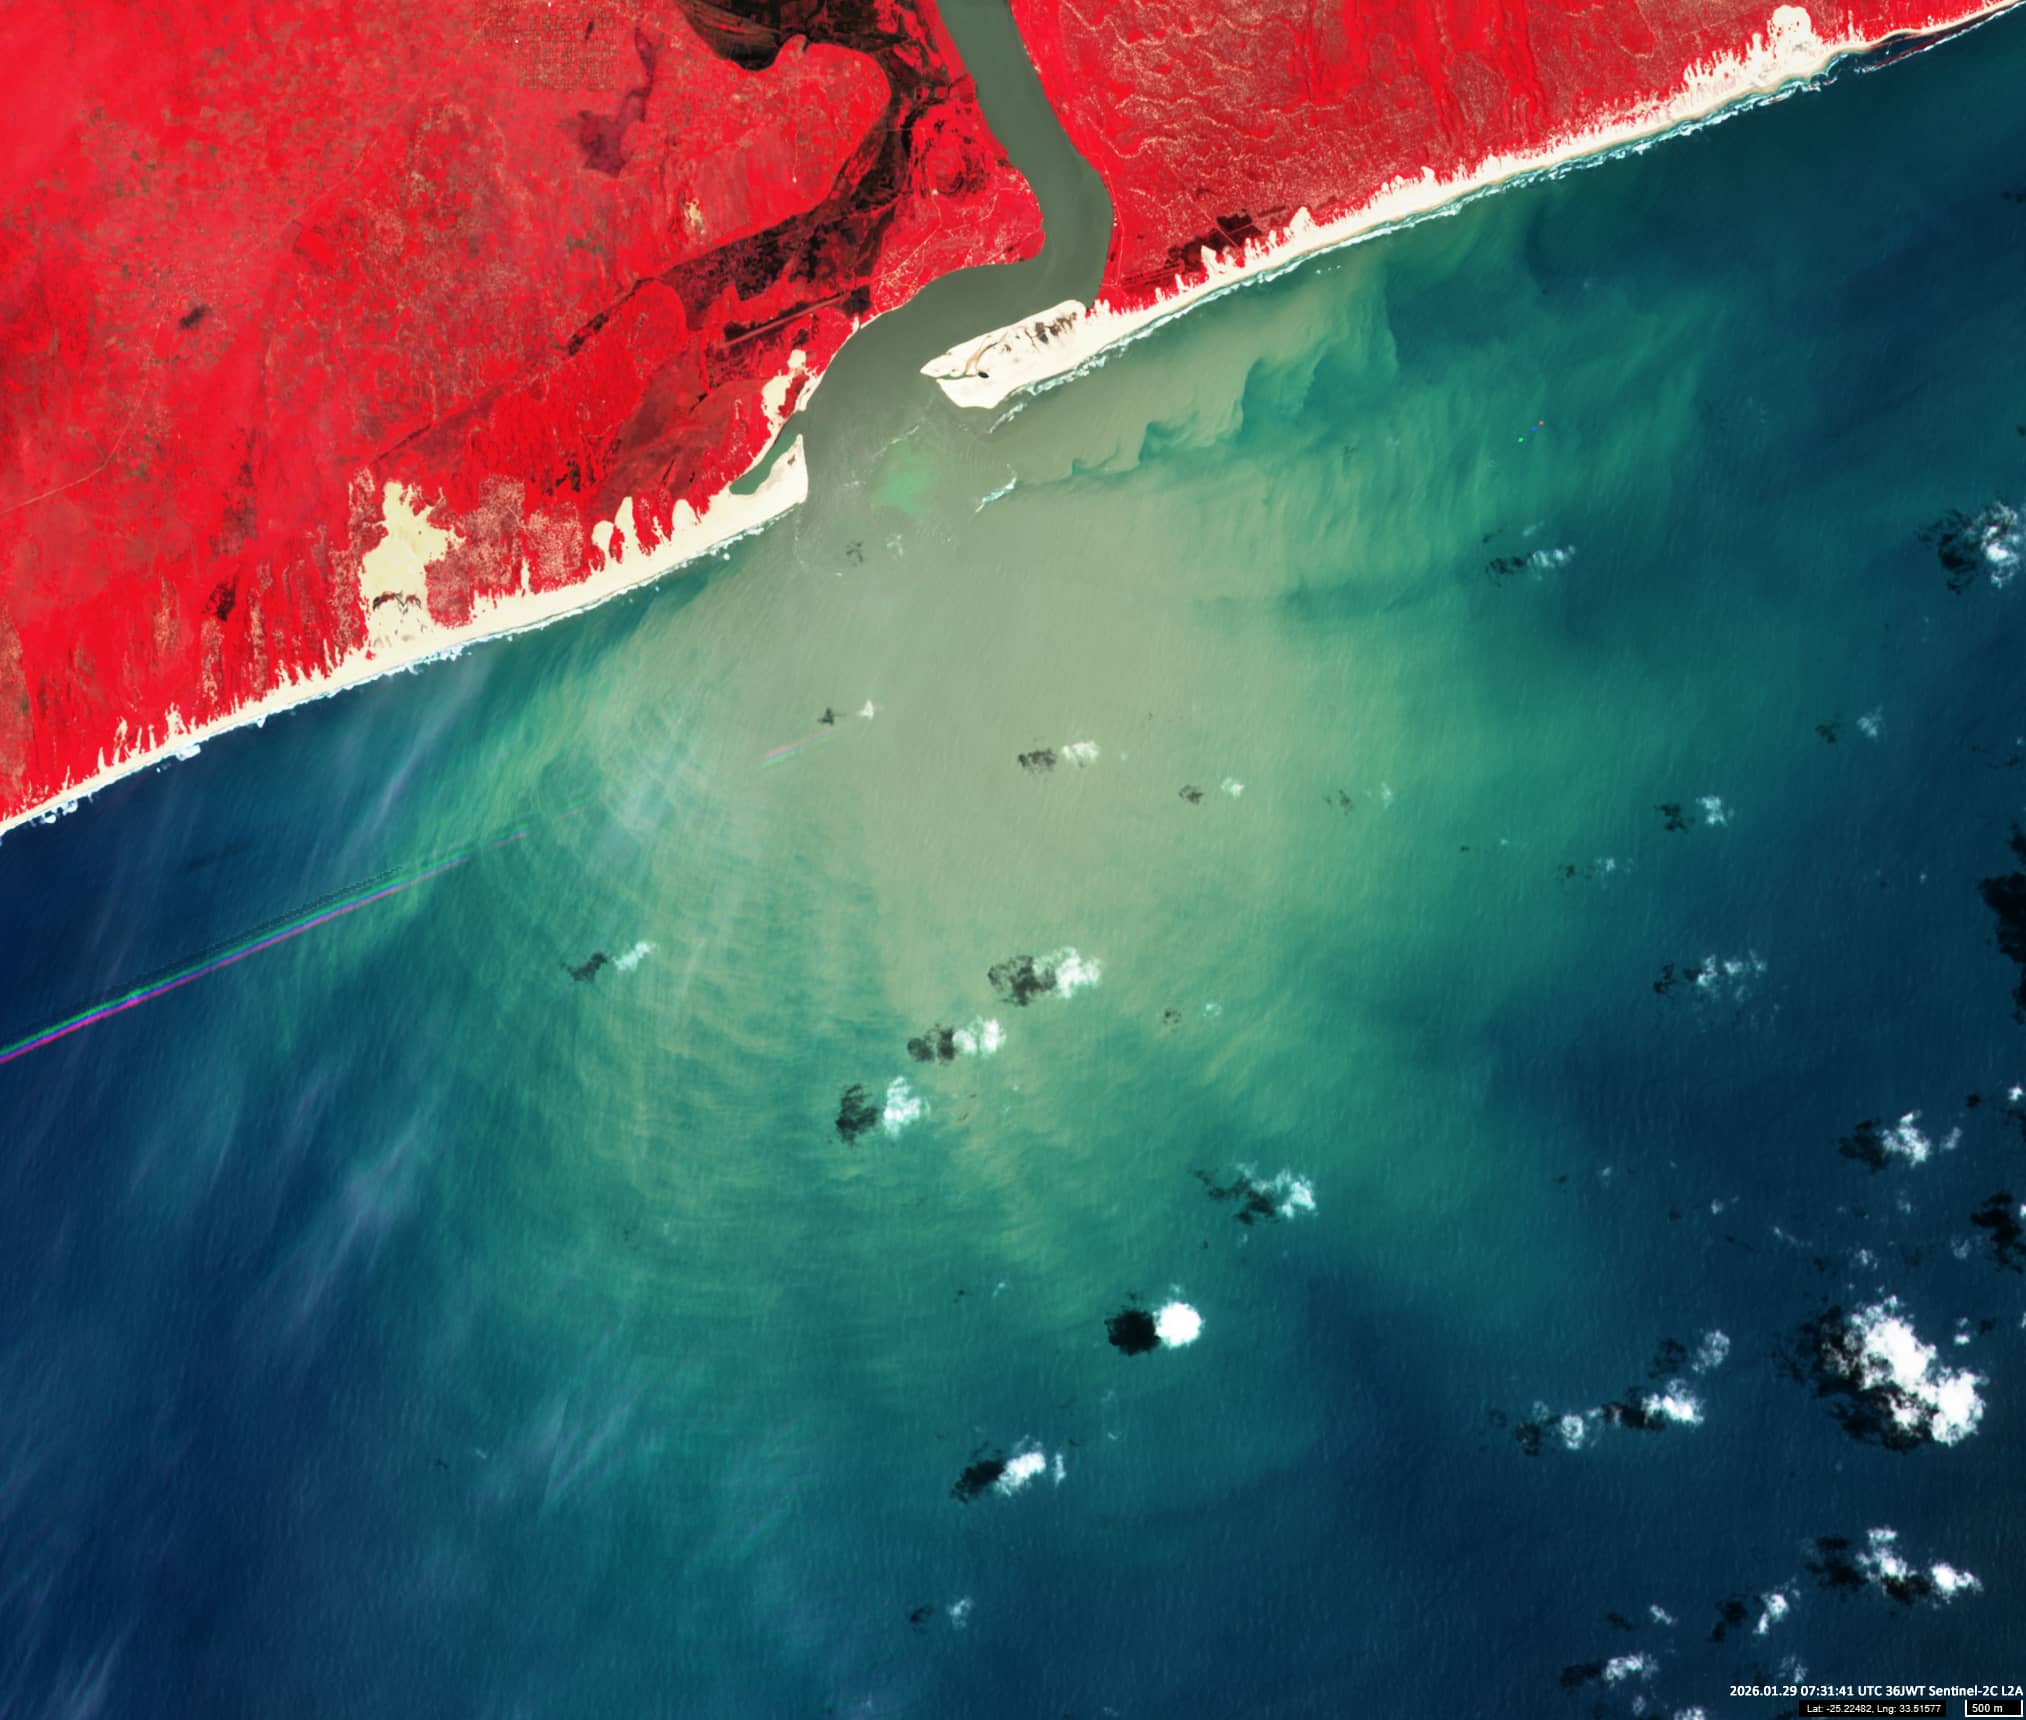
Figure 5 illustrates the increased sediment transport and distribution along the coast under flood conditions, showing the sediment cloud that flowed out of the mouth of the Limpopo River into the Atlantic Ocean during the peak of the flood.
Further reading
Limpopo River (Wikipedia)
Gaza Province (Wikipedia)
Floods Inundate Southern Mozambique (NASA Science)
Heavy rains and floods in central and southern
Mozambique (United Nations Office for the Coordination of Humanitarian Affairs, PDF download)
Crocodiles appear in towns amid floods (Africa Press)
Fig. 1
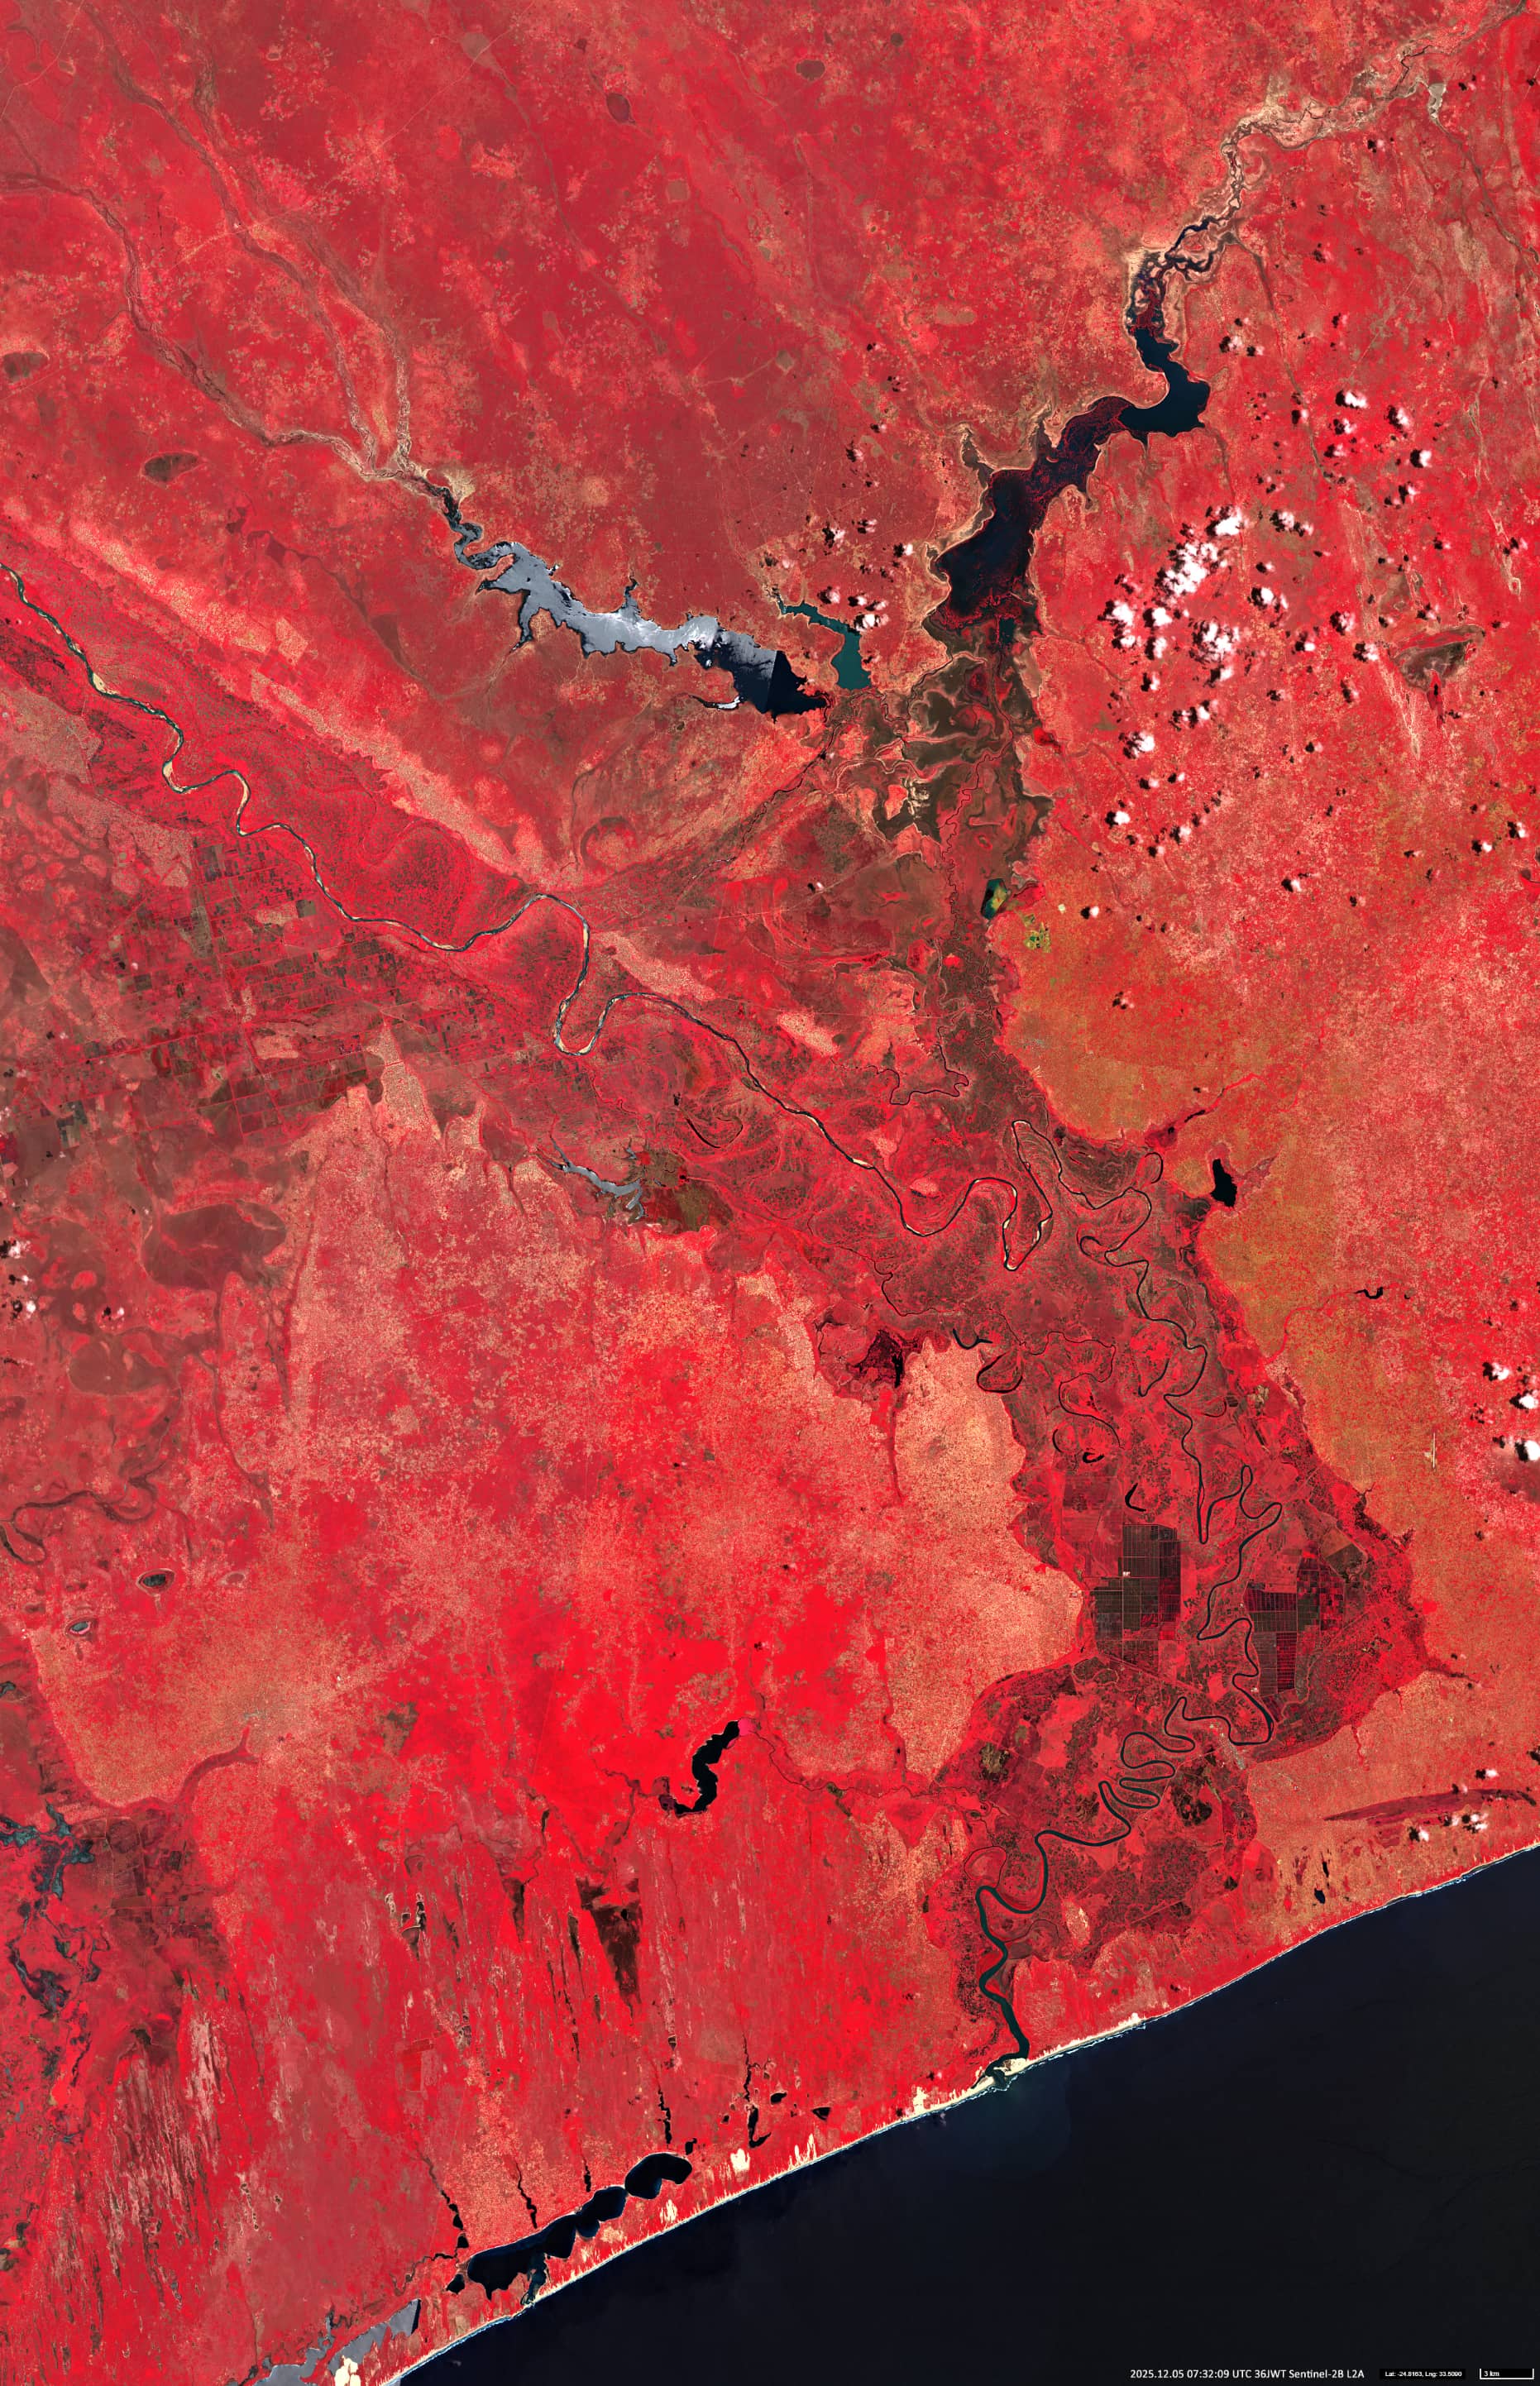
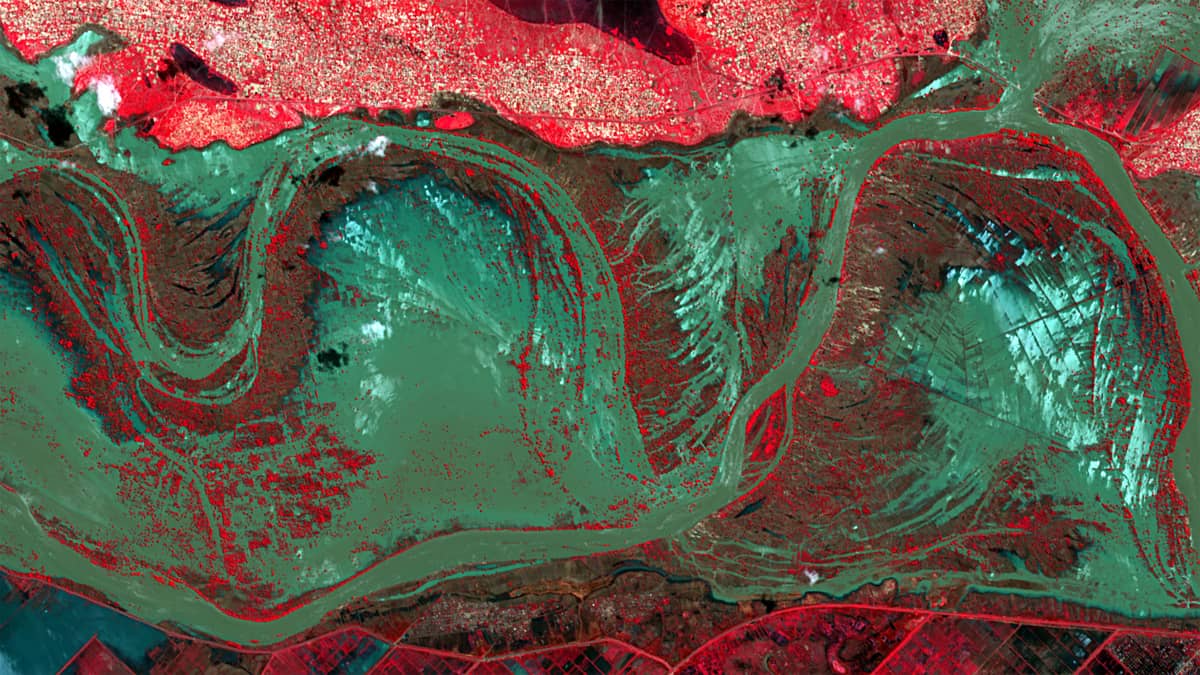
Fig. 2
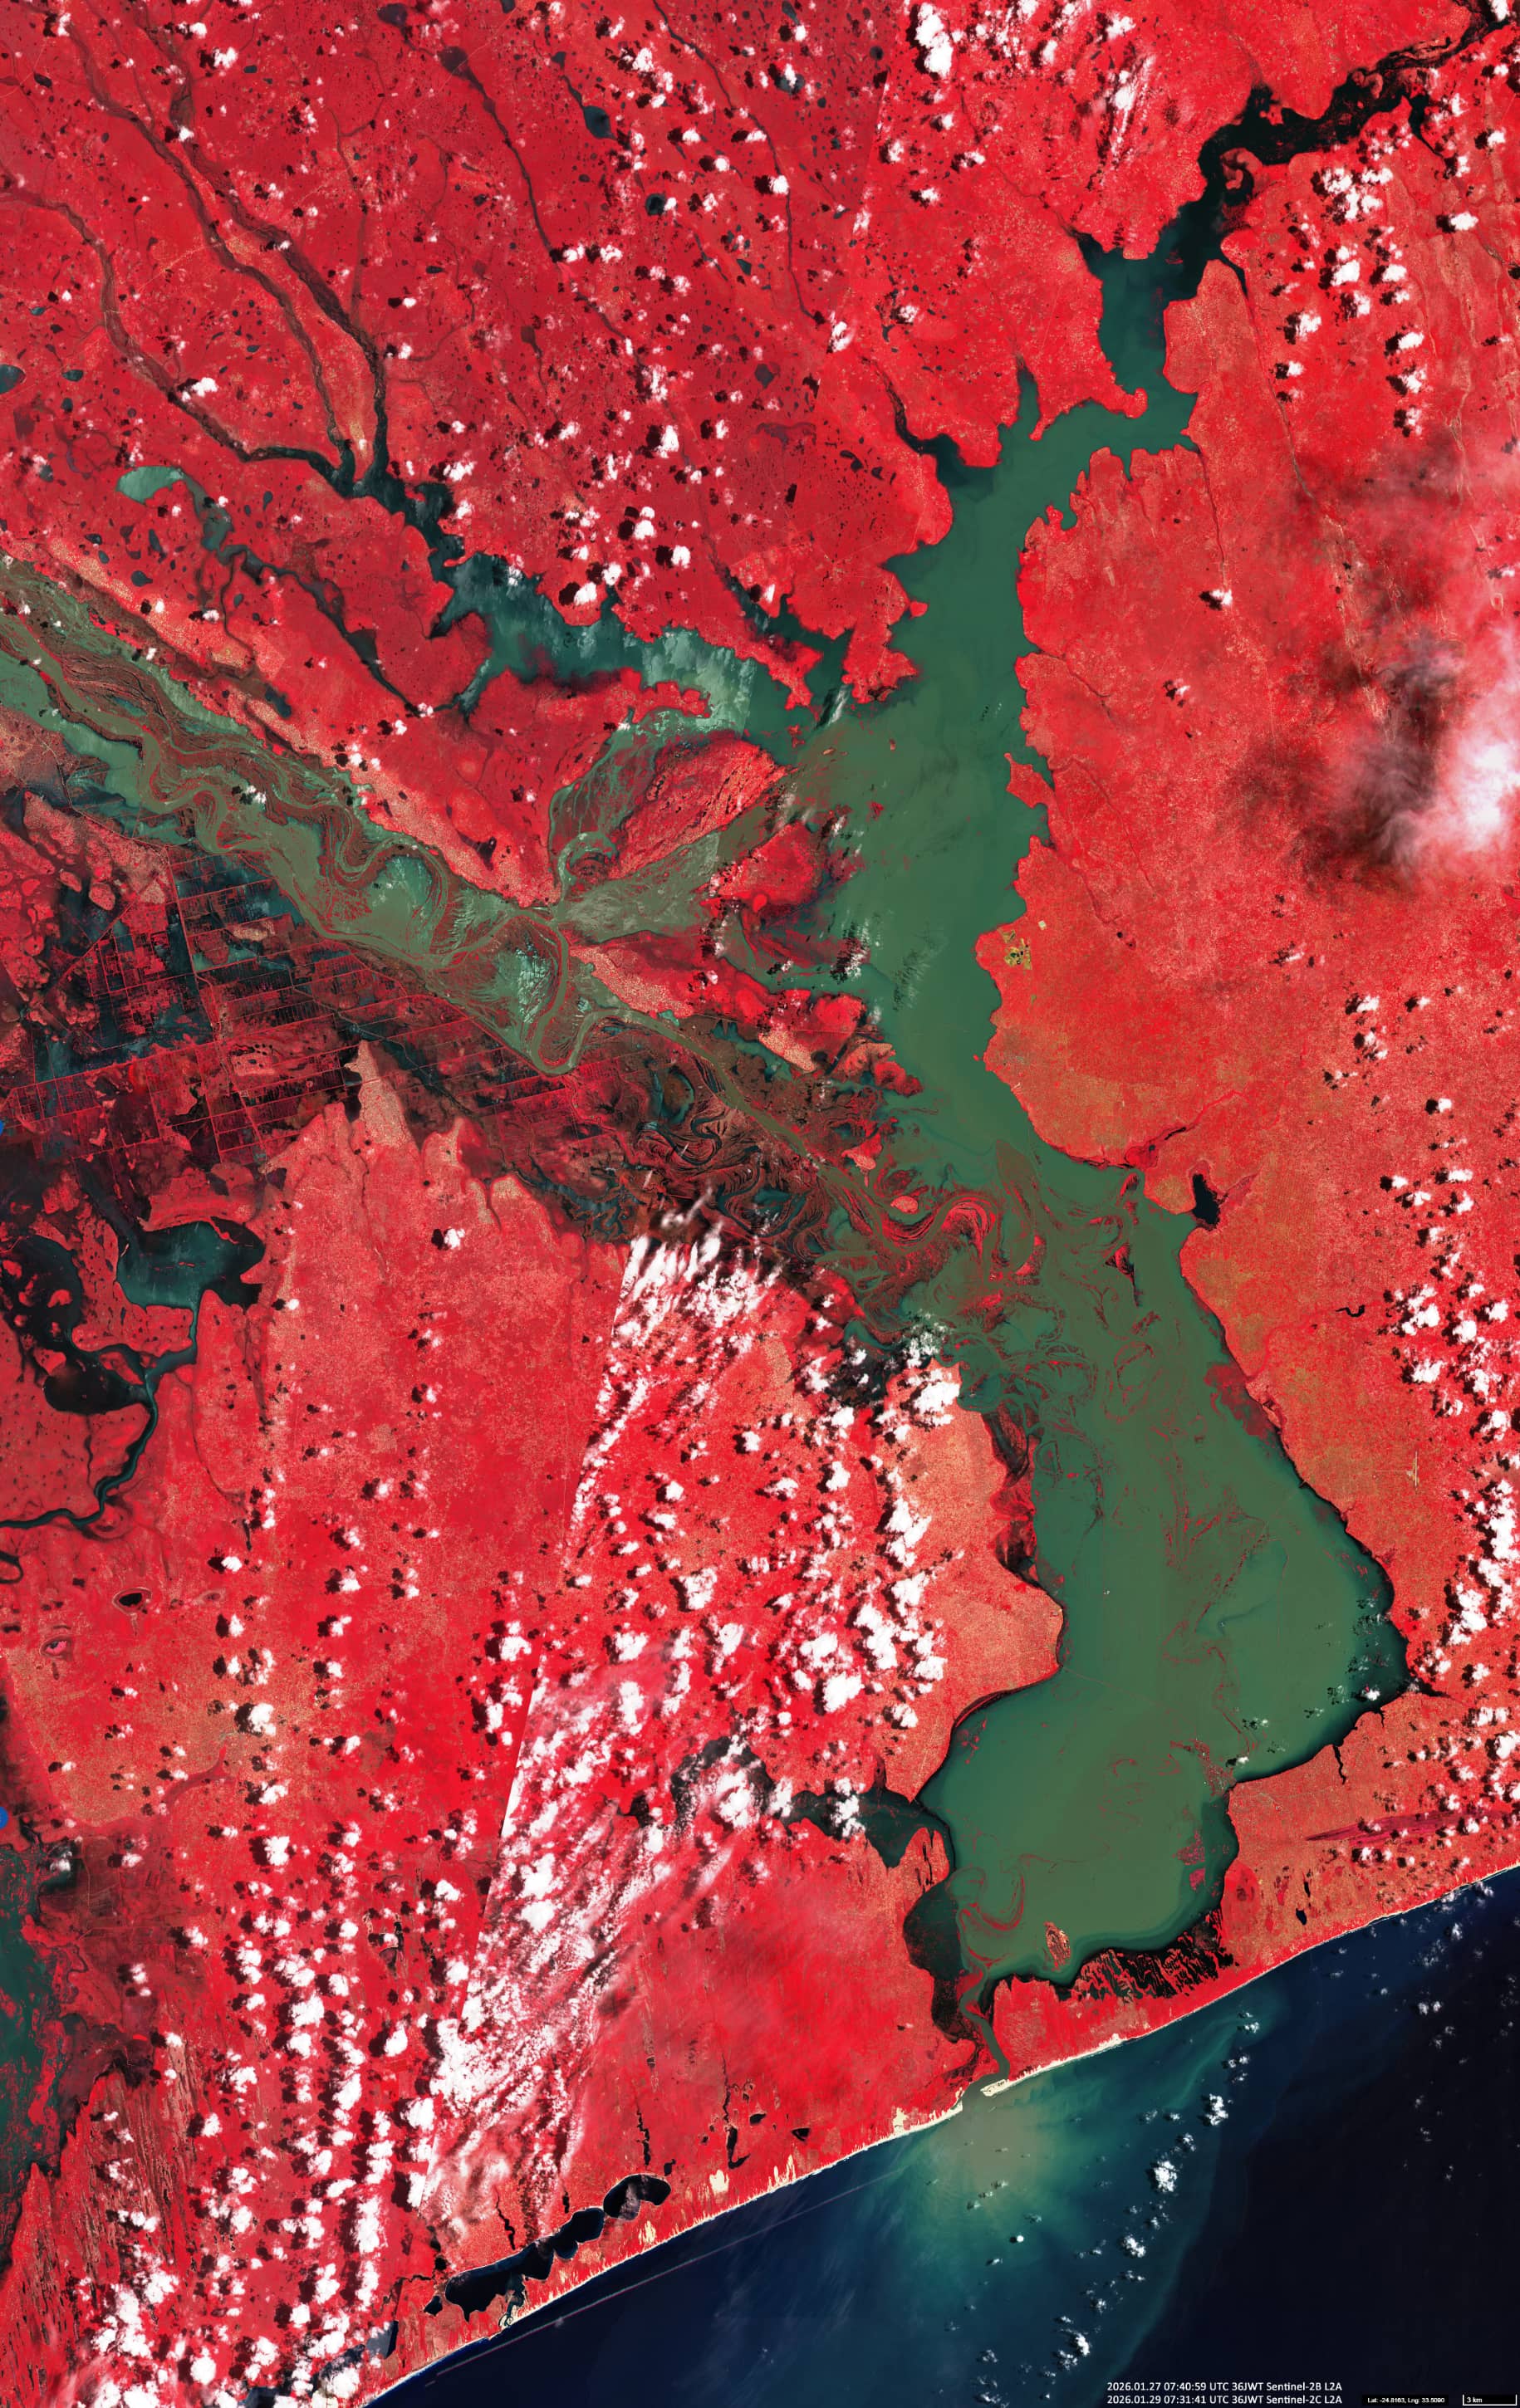
Fig. 3
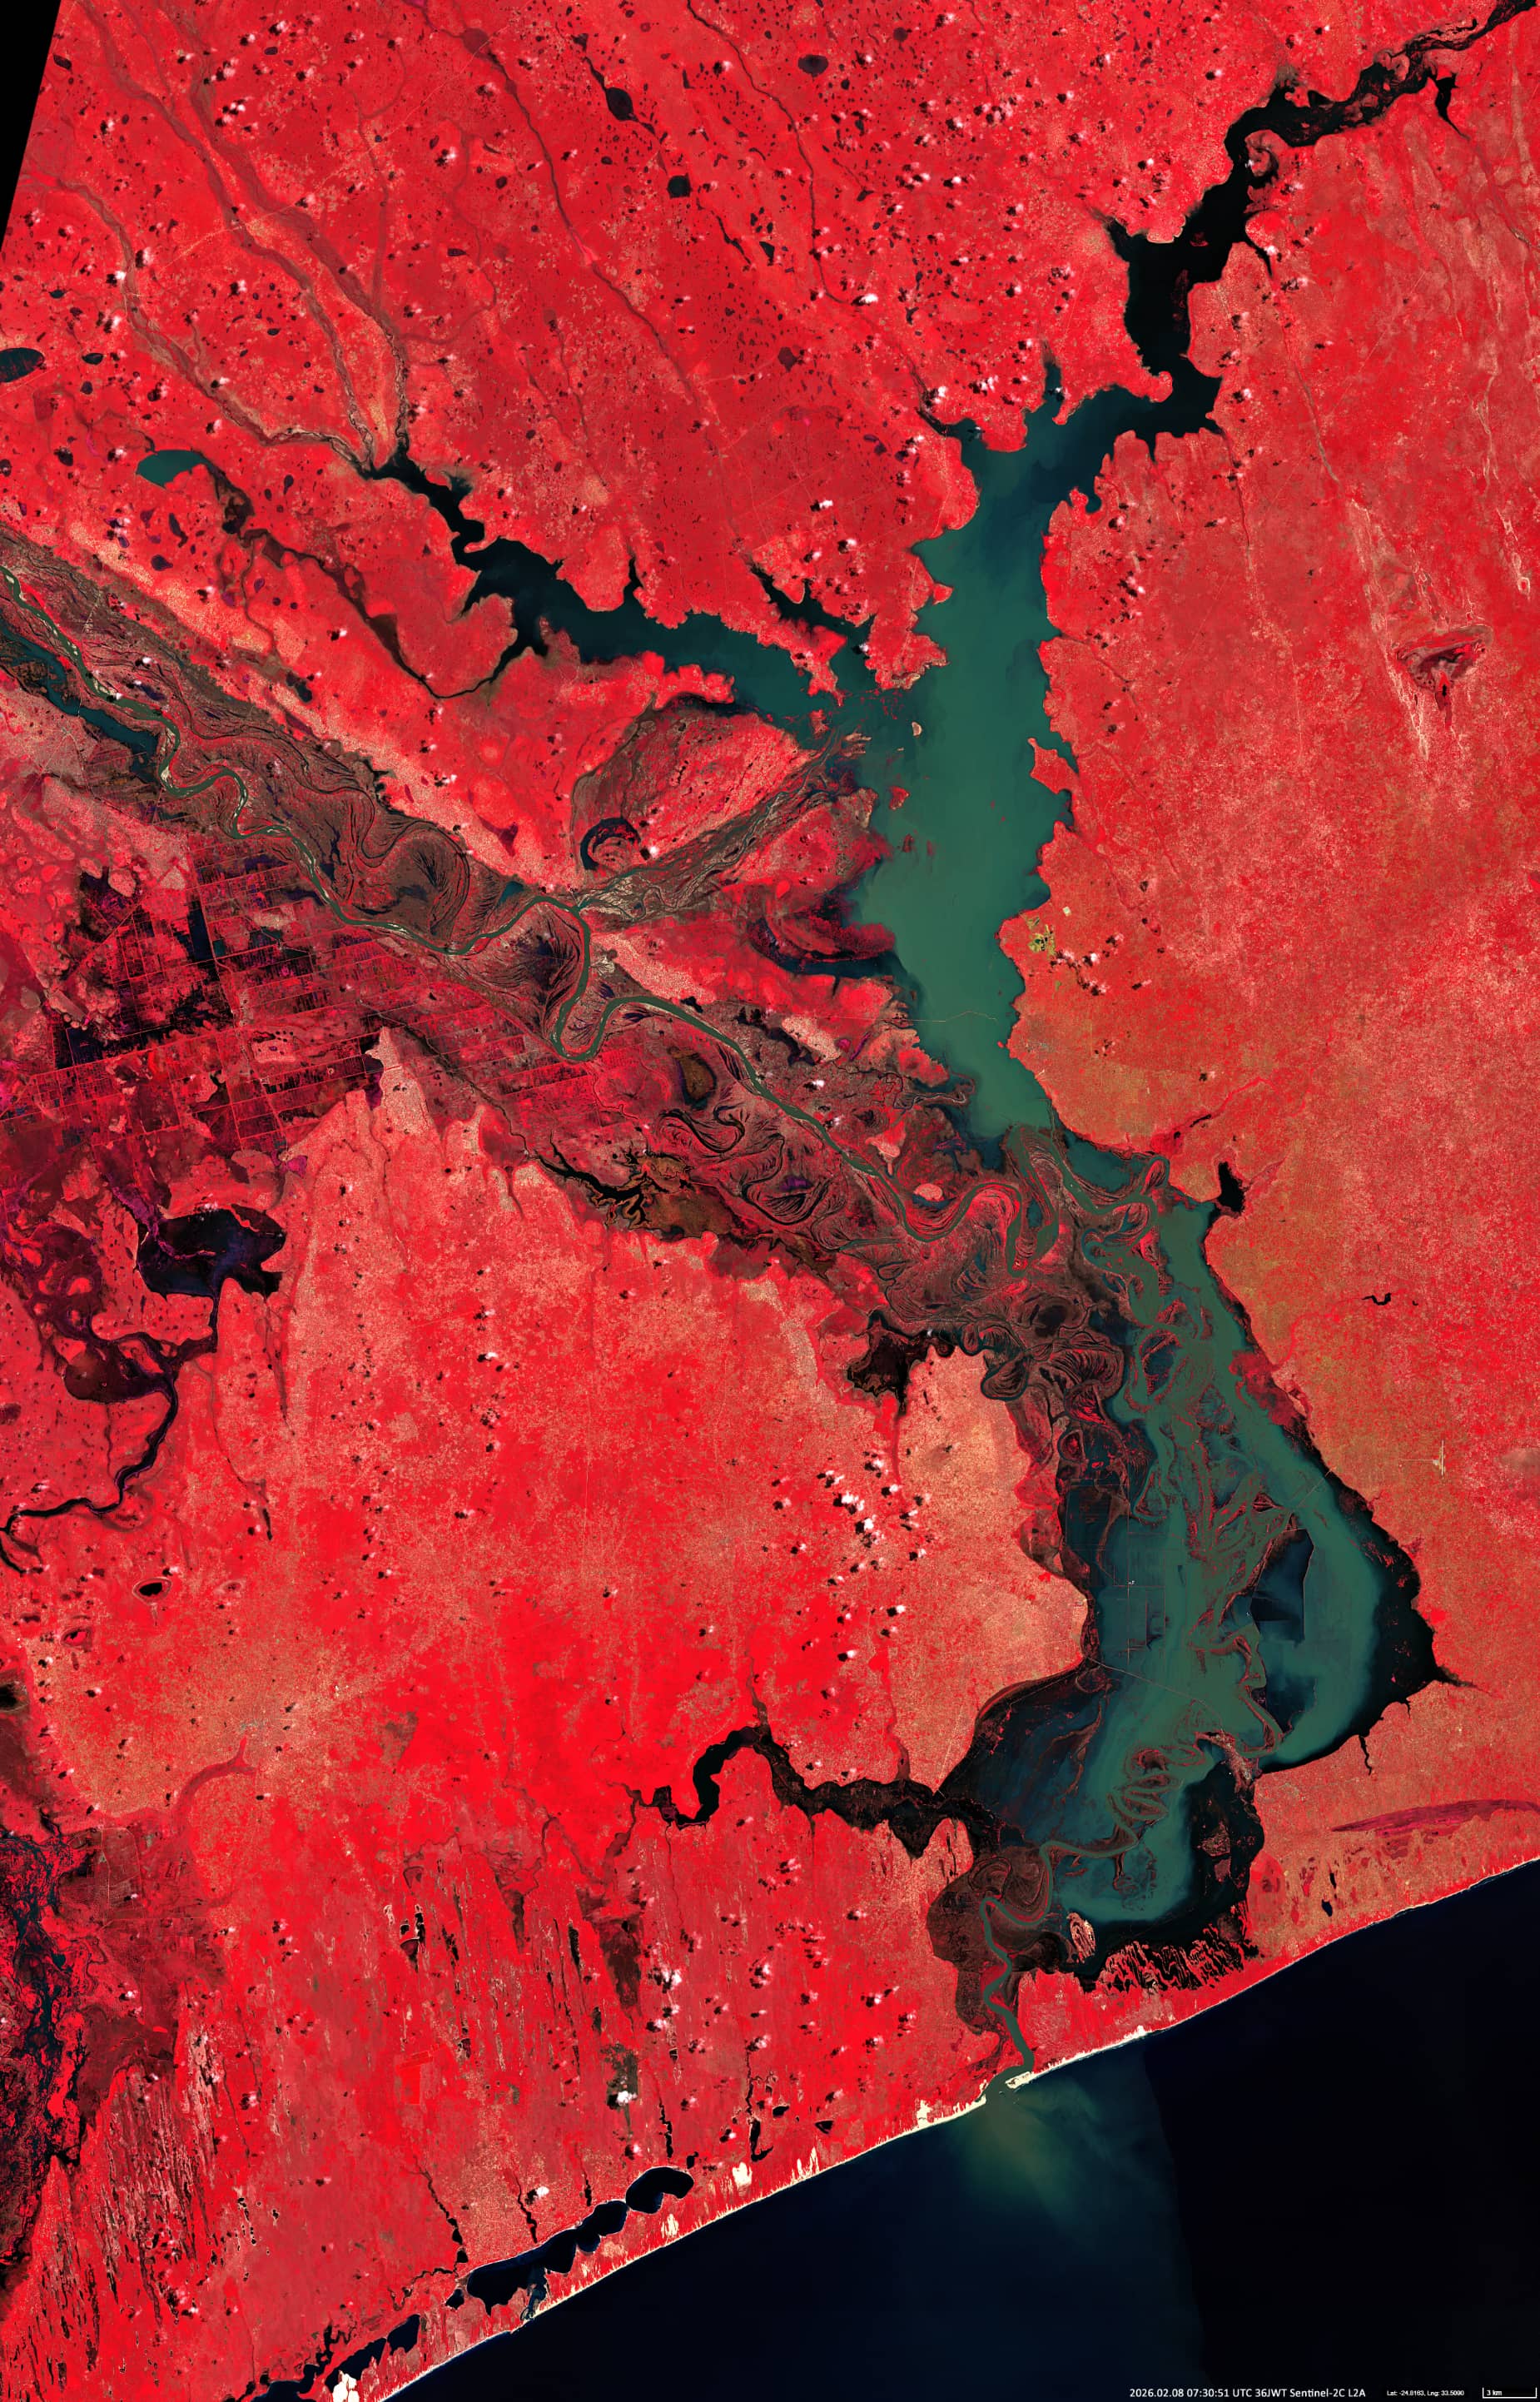
Fig. 4
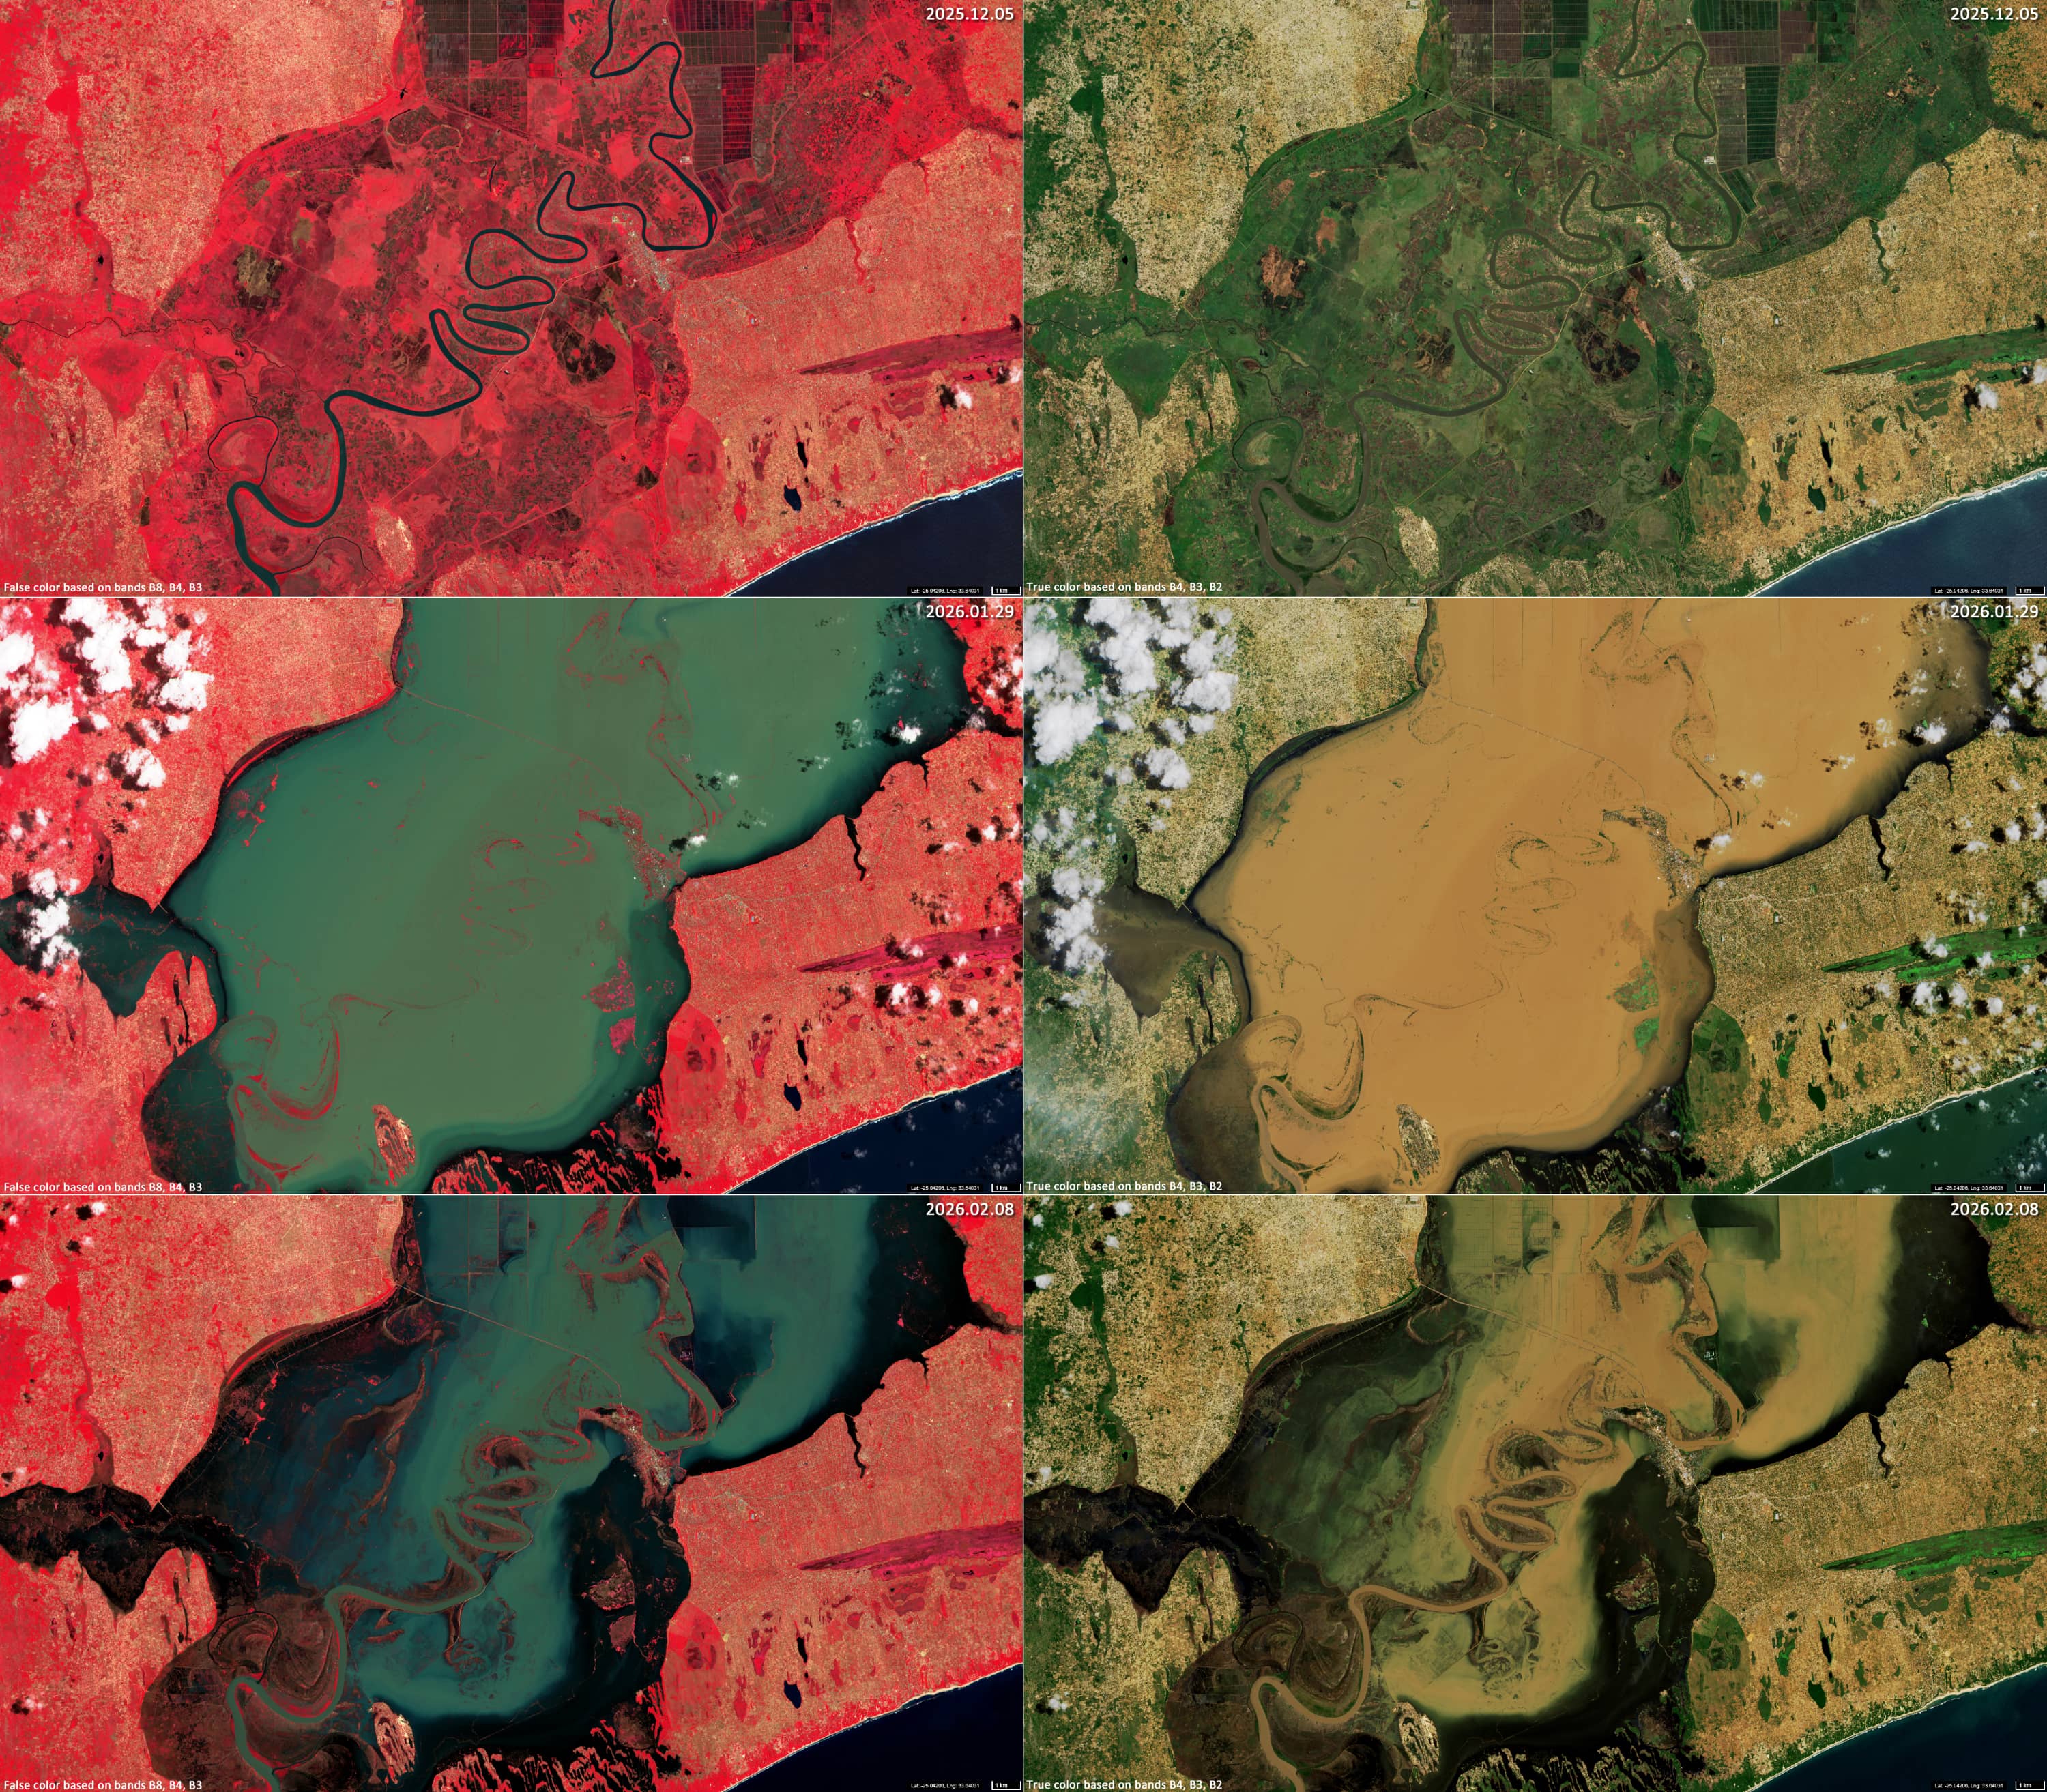
Fig. 5