|
| Home |
|
| Introduction |
|
| Contents |
|
| Links |
|
| Impressum | |
| Download |
| Home > Introduction | |
|
 |
Hamlet
Do you see yonder cloud that's almost in shape of a camel? Polonius By the mass, and 'tis like a camel indeed. Hamlet Methinks it is like a weasel. Polonius It is backed like a weasel. Hamlet Or like a whale. Polonius Very like a whale. William Shakespeare: Hamlet, Prince of Denmark: ACT III. Scene II |
- The Cloud Structures
- Methods
- Data Presentation
Clouds are the most mobile and changeable structure in the aspect of our live planet. Approaching the Earth it is impossible to look over their deversity, complexity and striking beauty.
The following work is to describe some cloud formations over the ocean as well as present examples of some of the most frequently found cloud structures.
The work includes the analysis of the notion "a cloud structure" (also known as "a cloud pattern"), the description of these structures, some of inherent physical parameters thereof, the statistics on allocation and a wide range of images.
The data that was received during many years from the MERIS - a programmable, medium-spectral resolution, imaging spectrometer installed on the ESA's satellite ENVISAT served as the source material; the Software BEAM VISAT developed by the Brockmann Consult, Germany, was used as the basic tool.
The work was conducted at the Brockmann Consult, Germany, within the framework of the "Image of the Day" project.
While observing the Earth from the height of 500-5000 km it is possible
to notice that the cloudy envelope of the planet is a ranked rather than
a chaotic accumulation of clouds as far as it concerns their forms. These
forms either repeat themselves or differ but in any event they reflect
definite process taking place in the atmosphere. The outward appearance
of CS remains invariable within a year and on the whole does not depend
on their geographical location.
All this allows to try to unify them on the base of appropriate criteria
and thus to speak about the cloud structures and systemize them.
In this work a "cloud structure" means a compact cloud formation
Very often some CSs may be associated to these or that geographic realities.
Formation and expansion of CSs also depend on the season. Some CSs consolidate
in large mega structures (MCS). Most of CSs are so large, that to observe
them from the surface of the Earth or from one side, for example from
the board of an airplane, means to obtain an incomplete picture.
Observation from above, namely from a satellite, may give the information
only about the top layer of the structure, but at the same time to cover
the whole object.
To see CSs from all sides would be, of course, the perfect choice.
A Cloud Structure usually differs from the clouds that constitute it. This difference concerns:
Besides:
The clouds constituting CS may serve as markers (an indicator) of the air mass movement. Being structurally unified they themselves influence the atmospheric phenomena.
![]()
The firm Brockmann Consult
is one of the receivers of the ESA satellite
ENVISAT information.
Since 2002 the MERIS
data has been transmitted to the firm and then distributed to the
ESA consumers world-wide. The software developed by Brockmann Consult
processes and collects all arriving fresh data and visualizes it in real
resolution (1120 pixels width, pixel Size 1040m x 1200m), so that the
data could be studied just after it had arrived.
In 2003 an Internet project "Image
of the Day" was launched.
According to the said project the whole body of MERIS level 1 data (covering
already more than 27000 orbits) is examined in order to discover interesting
nature phenomena, and is then represented as RGB colour pictures. These
colours have near resemblance to natural ones.
Thus certain weather events and cloud structures arrested special attention
and were stored as RGB pictures.
In 2006 the systematization of the new as well as of the already existing
cloud data started.
As the result the data was stored as JPG pictures and grouped pursuant
to its types.
The BEAM VISAT software
developed on the Brockmann Consult
allows visualizing and processing both the MERIS
level 1 satellite data and supplementary information.
Fragments of interest will be cut out from whole orbit and visualized
e.g. from the TOA
radiance band 1 MERIS channel (wavelength: 412.691nm, range 9.937nm)
(where the clouds are easily recognized).
They are first possibly contrasted and geographically referenced and then
stored, possibly along with the additional information. The name of the
stored file contains the date and the orbit number of the fragment.
The BEAM VISAT software
allows to observe the MERIS
level 2 data as well.
The values of Cloud top pressure, Cloud albedo and Cloud type index, contained
in the MERIS level
2 data, are important as cloud characteristics.
The Cloud top height can be calculated by the formula
h [km] = -8
        * LOGS (cloud_top_press [hPa]/1013)
.
The type of the clouds contained in a cloud structure is indicated in the ESA Cloud type index table.
|
|
0 - 3.6
|
3.6 - 23
|
23 - 379
|
| 50 - 440 | 135 (Cirrus) Ci | 136 (Cirrostratus) Cs | 137 (Deep convection) Cb |
| 440 - 680 | 132 (Altocumulus) Ac | 133 (Altostratus) As | 134 (Nimbostratus) Ns |
| 680 - 1000 | 129 (Cumulus) Cu | 130 (Stratocumulus) Cs | 131 (Stratus) St |
An example of the "of the Morning Glory" Cloud Structure
of 2007.02.08, orbit 25836: (from right to left) RGB image in the visual
412,691 Nm channel, Cloud top height with the Scale in [km], Cloud type
index with the Scale. 
The BEAM VISAT software allows the whole orbit to be projected on the
world map (in the case in question the geographical projection is used).
Therefore each cloud structure revealed can be interactively superposed
on the map of the world and geographically referenced. Using the daily
MERIS data (14
orbits per day) it is possible to make up the picture of the global occurrence,
season changes and theobservation frequencies of different cloud structures.
This does not only help to describe the cloud structure, but also enables
to better understand the Earth's climate processes.
Examples of observation frequency diagrams (the statistic
work is carried on the period of 04.2006-10.06 and 02.07). The darker
the point is, the more often observations were made.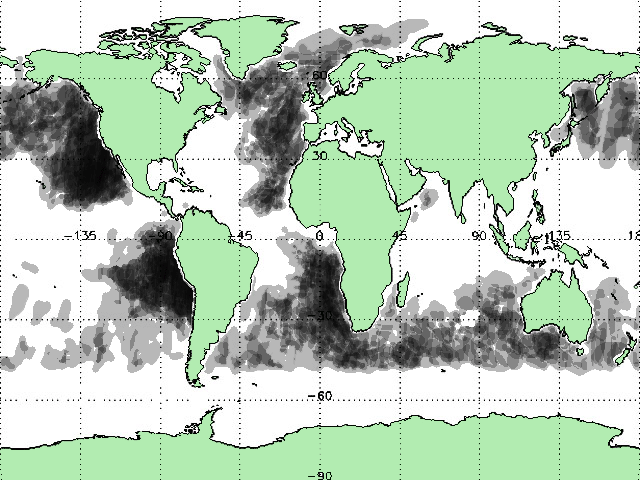
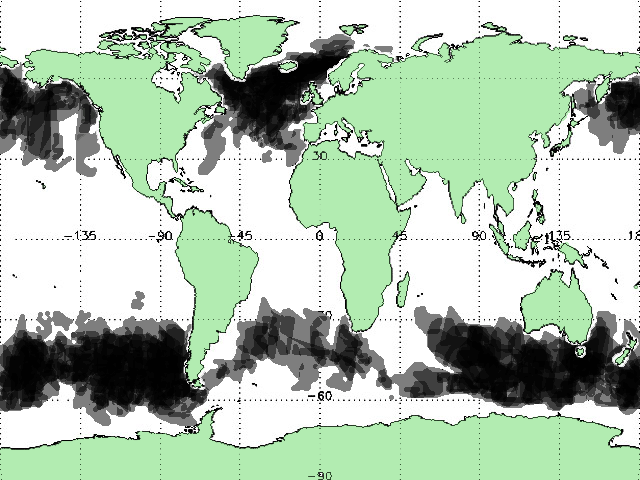
"Close Cells" observation diagram for 06.06![]() "Enhanced
Cumulus" observation diagram for 10.06
"Enhanced
Cumulus" observation diagram for 10.06
To present the most of structures the following data will be offered:
|
|